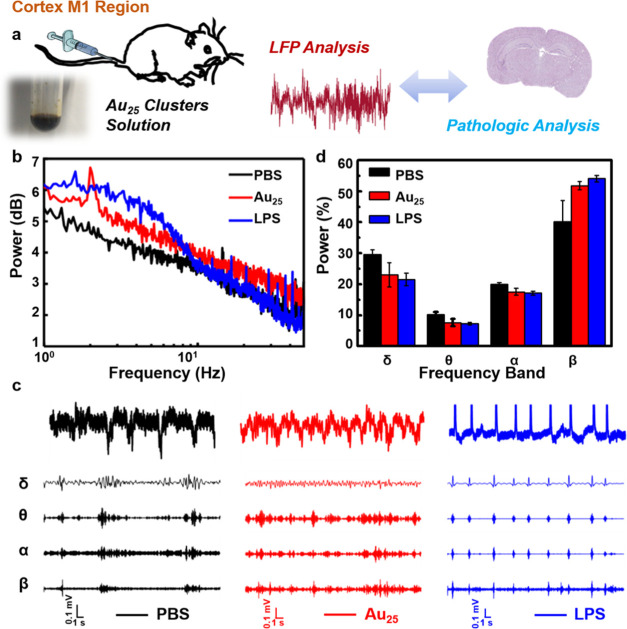
Figure 3.
Effects of the ultrahigh dose of Au25 clusters on power in the cortex M1 region. (a) Elementary diagram of the excretion analysis of Au25 clusters using LFP analysis and pathologic analysis. (b) Power spectrum analysis of the three groups. (c) Comparison of signals in delta, theta, α, and β frequency rhythms. (d) Grand average of the power of various rhythms.

