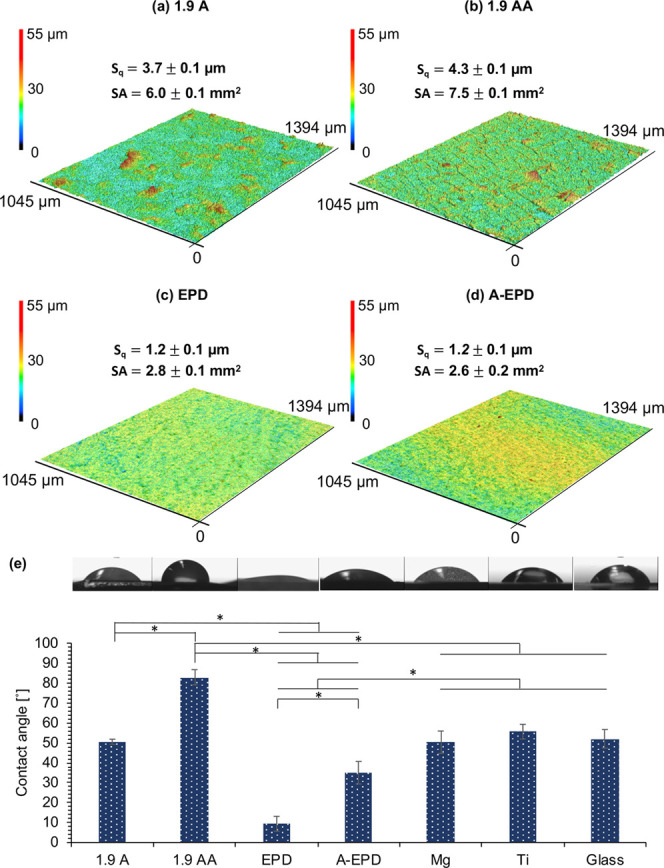
Figure 6.

Surface topography, surface roughness, surface area, and contact angle measurements for the surface-treated Mg samples of 1.9 A, 1.9 AA, EPD, and A-EPD. (a–d) Surface topography maps from 3D laser scanning and the calculated surface roughness and surface area for (a) 1.9 A, (b) 1.9 AA, (c) EPD, and (d) A-EPD samples. The scanning area was 1045 μm × 1394 μm. (e) Contact angle measurements for 1.9 A, 1.9 AA, EPD, and A-EPD samples, controls of Mg and Ti, and glass references. Tryptic soy broth (TSB) droplets were used for the contact angle measurements on all samples. The corresponding droplet micrographs were shown on top of the contact angle data. Values are mean ± standard deviation; n = 3. *p < 0.05.
