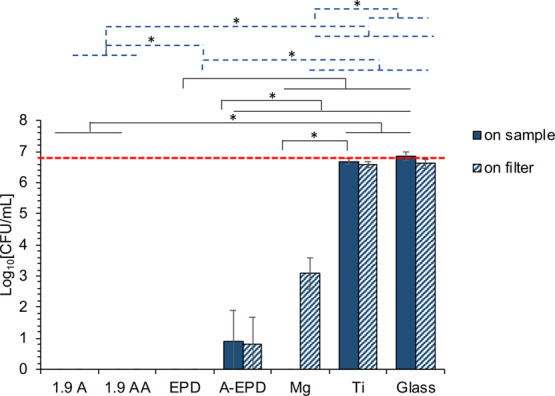
Figure 7.

Bacterial density after being cultured in TSB with the surface-treated Mg samples of 1.9 A, 1.9 AA, EPD, and A-EPD, as well as the controls of Mg and Ti, and the glass references for 24 h, as quantified from the colony forming unit (CFU). Bacteria were seeded at an actual concentration of 6 × 10⁶ CFU/mL, as indicated by the red dashed line. The values are the mean ± standard deviation; n = 3. *p < 0.05. The black solid line indicated the statistical analysis results for the bacterial density on the sample surfaces. The blue dashed line indicated that the statistical analysis results for the bacterial density on the filters covered the sample surfaces.
