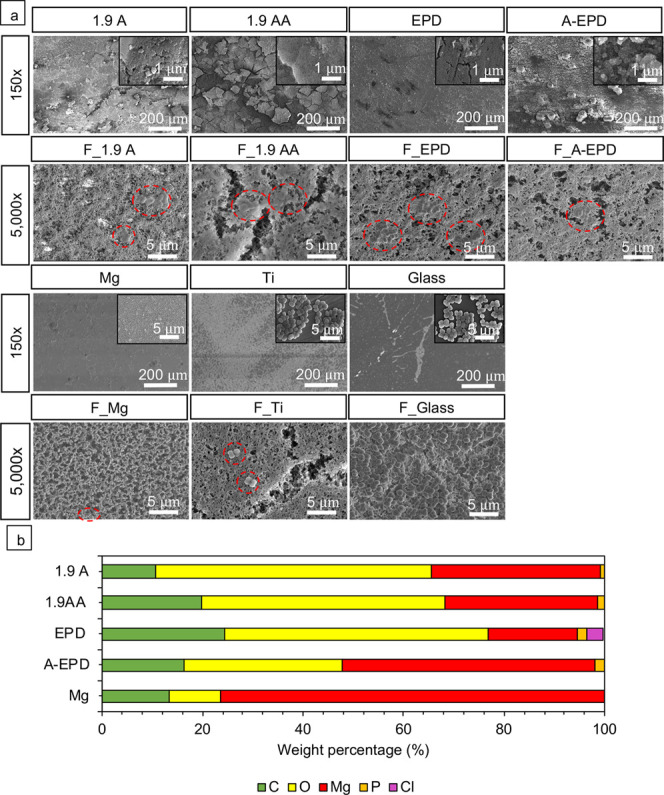
Figure 8.

Characterization of the surface microstructure and composition after 24 h of bacterial culture. (a) SEM images of the 1.9 A, 1.9 AA, EPD, A-EPD, Mg, Ti, glass, and the respective nitrocellular filter papers (with F as a prefix in abbreviation) on each sample after bacterial culture. The abbreviations of F_1.9 A, F_1.9 AA, F_EPD, F_A-EPD, F_Mg, F_Ti, and F_Glass refer to the filters on the corresponding samples. SEM images of the samples were obtained at an original magnification of 150× and 40 000× (the inset SEM images), showing nano-to-micron scale surface features for each sample after bacterial culture. SEM images of the respective nitrocellular filter papers were obtained at an original magnification of 5000×. Scale bar = 200 μm for all SEM images at an original magnification of 150×. Scale bar = 5 μm for all SEM images at an original magnification of 5000×. Scale bar = 1 μm for all SEM images at an original magnification of 40 000×. The red dashed circles on the SEM images highlight the adhered S. aureus on the surfaces of different samples. Surface elemental compositions (weight %) of the 1.9 A, 1.9 AA, EPD, A-EPD, and Mg samples were quantified by EDS area analyses and plotted in the bar graph. The EDS analyses were performed on the SEM images at an original magnification of 150×.
