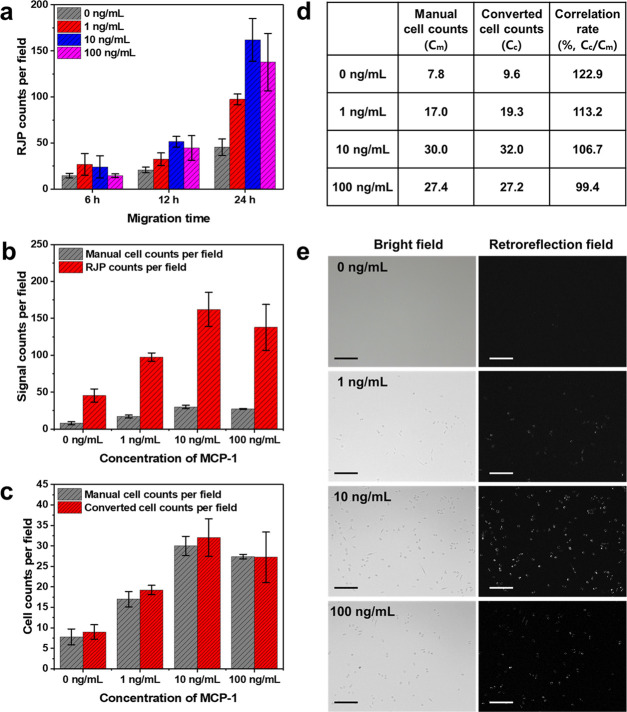
Figure 6.
Retroreflection-based migration assay result analysis for real-time migratory cell quantification and evaluation of cell numbers from the acquired retroreflection signals. (a) Migratory cell quantification results from various migration times. (b) Comparative study of migratory cell analysis with various concentrations of MCP-1 using manual counting and retroreflection signal counting. (c) Verification of correlation testing involving retroreflection-based cell counting and manual cell counts. Error bars were calculated as mean ± S.D. (d) Correlation rate chart between manual cell counts and retroreflection signaling-based converted cell counts. (e) Microscopic images of migratory cells exposed to various concentrations of MCP-1 under retroreflective optical setup conditions (scale bar = 200 μm).

