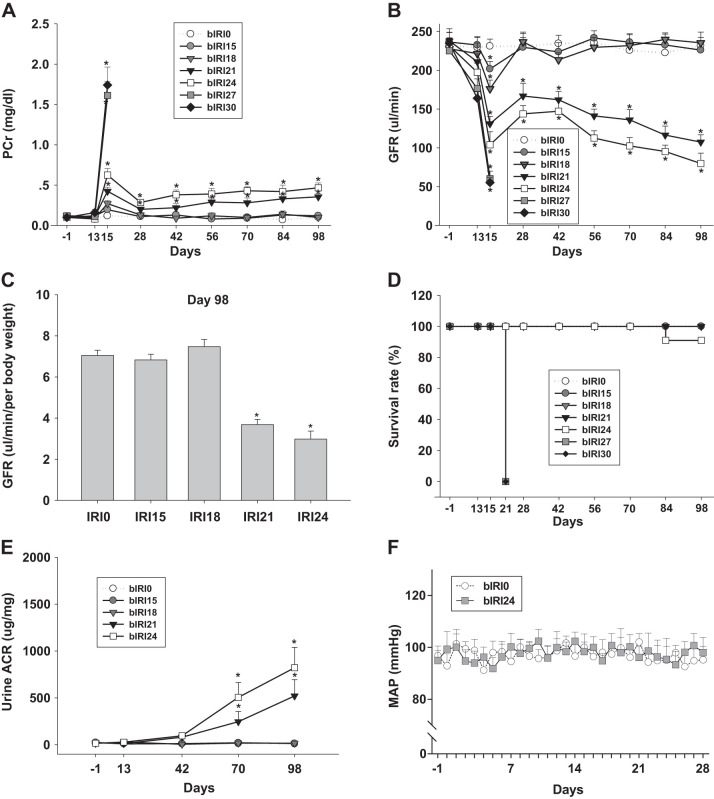
Fig. 1.
Parameters of the two-stage bilateral ischemia-reperfusion injury (bIRI) model. A and B: phosphocreatine (PCr; A; n = 15 or 16 mice/group) and glomerular filtration rate (GFR; B; n = 15 or 16 mice/group) in two-stage bIRI models from day −1 to day 98. bIRI0, bIRI15, bIRI18, bIRI21, bIRI24, bIRI27, and bIRI30, two-stage bIRI 0-, 15-, 18-, 21-, 24-, 27-, and 30-min groups, respectively. C: GFR normalized to body weight (n = 15 or 16 mice/group) in two-stage bIRI models at day 98. *P < 0.01 vs. the bIRI0 group. D: survival rate (D; n = 15 or 16 mice/group) of two-stage bIRI models from day −1 to day 98. E: urine albumin-to-creatinine ratio (ACR; n = 9–11 mice/group) in two-stage bIRI models from day −1 to day 98. *P < 0.01 vs. the bIRI0 group. F: mean arterial pressure (MAP; n = 6–8 mice/group) in two-stage bIRI0 and bIRI24 groups from day −1 to day 28. *P < 0.01 vs. the bIRI0 group. For A, B, E, and F, statistical differences were calculated by repeated-measures two-way ANOVA followed by a Sidak multiple-comparisons test. For C, statistical differences were calculated by two-way ANOVA followed by a Sidak multiple-comparisons test.

