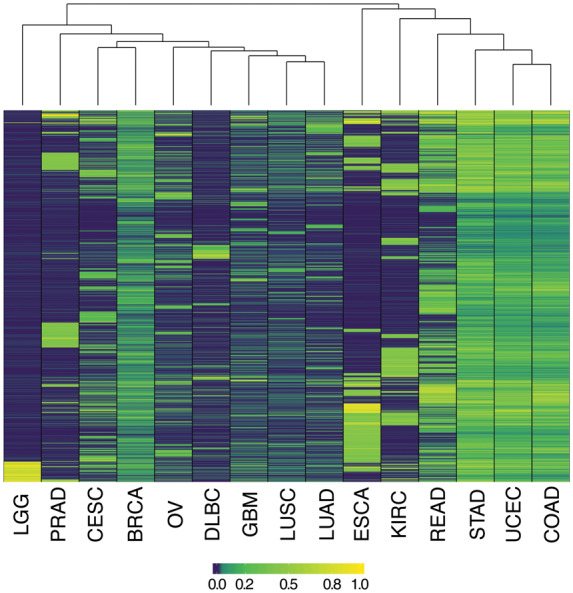
Fig. 2.

Informative markers for diagnosing MSI vary across cancer types. The 2000 most informative microsatellites (rows) for discriminating MSI positive from MSI negative tumors from each of the indicated cancer types (columns) are displayed. Heatmap coloration indicates the association of individual loci with the MSI-H phenotype, normalized on a per-cancer type basis from zero (least significant) to one (most significant). Hierarchical clustering of cancer types according to similarity in microsatellite mutation patterns is indicated at top. TCGA abbreviations for cancer types are as described in the Table 1 footnote.
