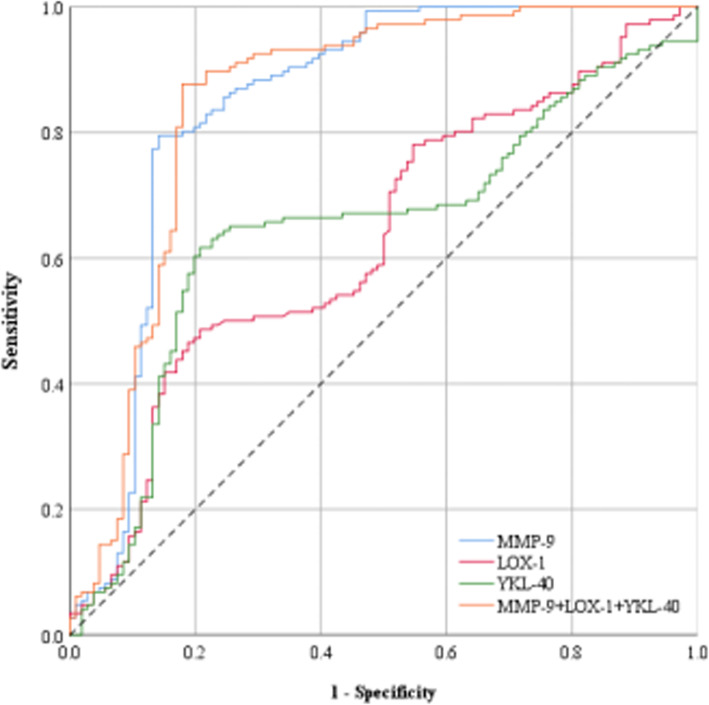
Fig. 1.
ROC curve of three factors for MMP-9, LOX-1, YKL-40 independent andcombineddiagnosis of vulnerable plaques. The ordinate is the sensitivity, representing the true positive rate, and the abscissa is the specific generation, which represents the false positive rate. The larger the area under the curve, the higher the accuracy of the diagnosis of vulnerable plaque. The curve area under the red line (0.630) represents the accuracy of LOX-1 in diagnosing vulnerable plaque. The curve area under the green line (0.646) represents the accuracy of YKL-40 in diagnosing vulnerable plaque. The area of the curve under the blue line (0.847) represents the accuracy of MMP-9 in diagnosing vulnerable plaque. The area of the curve under the orange line (0.850) represents the accuracy of the combined diagnosis of vulnerable plaques by the three markers LOX-1, YKL-40 and MMP-9

