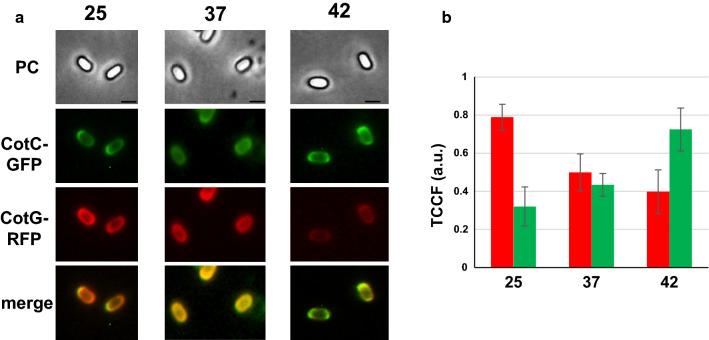
Fig. 4.
Fluorescence microscopy analysis of spores displaying simultaneously CotG-RFP and CotC-GFP. a Spores of strain RH406, carrying the cotG::rfp and cotC::gfp fusions were produced at the three temperatures and observed with a fluorescent microscope. The exposure time was the same for all samples. Phase contrast (PC), red- fluorescence (CotG-RFP) and green-fluorescence (CotC-GFP) microscopy and merge of the fluorescence images of representative spores are reported. b Quantitative analysis of the fluorescence of 200 spores as in panel a, performed with the ImageJ software, as previously reported [22]. The Y-axis describes the Total corrected cellular fluorescence (TCCF) value

