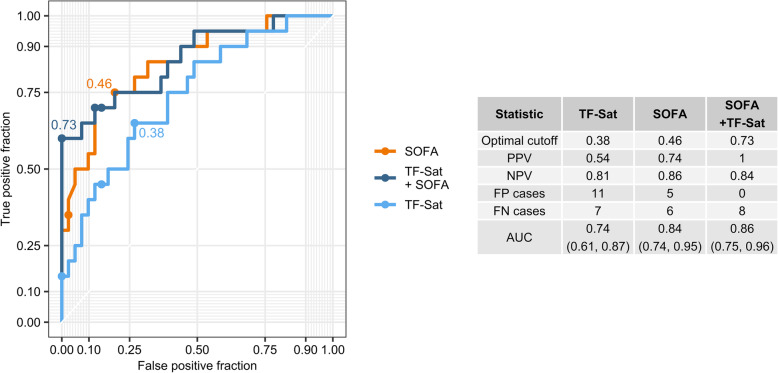
Fig. 4.
Predictive power of transferrin saturation in receiver-operator curve (ROC) analysis. Theoretical survival probabilities for study participants were calculated using the age- and sex-adjusted SOFA, age- and sex-adjusted TF-Sat and the age- and sex-adjusted SOFA-compound model identified in Fig. 3b (SOFA + TF-Sat). The plot displays ROC for the models with optimal cutoffs labeled. The table presents calculated optimal cutoffs, positive and negative predictive values at the optimal cutoff (PPV and NPV), numbers of false-positive and false-negative cases at the optimal cutoff (FP and FN), and area under the curve (AUC) for ROCs with 95% CI

