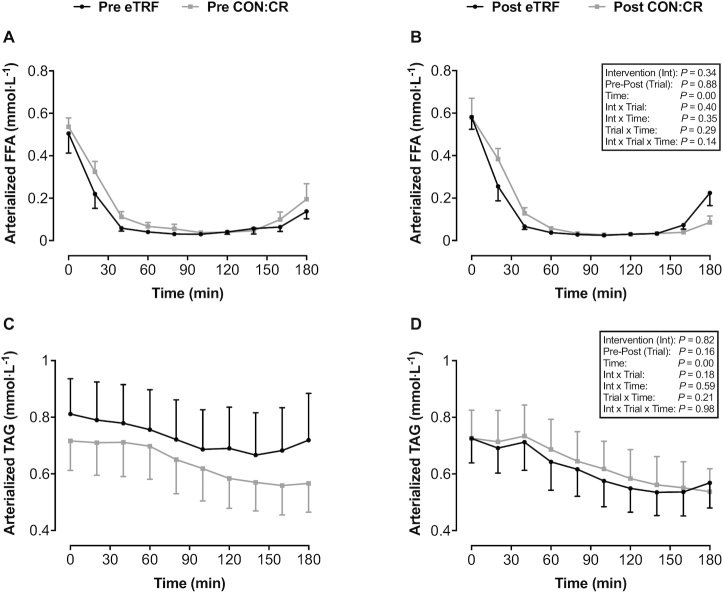
FIGURE 4.
(A, B) Arterialized plasma FFA and (C, D) serum TAG in response to consumption of a liquid test meal before (pre) and after (post) 2 wk of dietary intervention. All data are means ± SEMs; n = 8 per group. P values displayed in text boxes refer to mixed-design 3-factor ANOVA (intervention group × pre-post trial × sampling time) performed for the entire postprandial period. CON:CR, control/caloric restriction; eTRF, early time-restricted feeding; FFA, free fatty acid; TAG, triglyceride.

