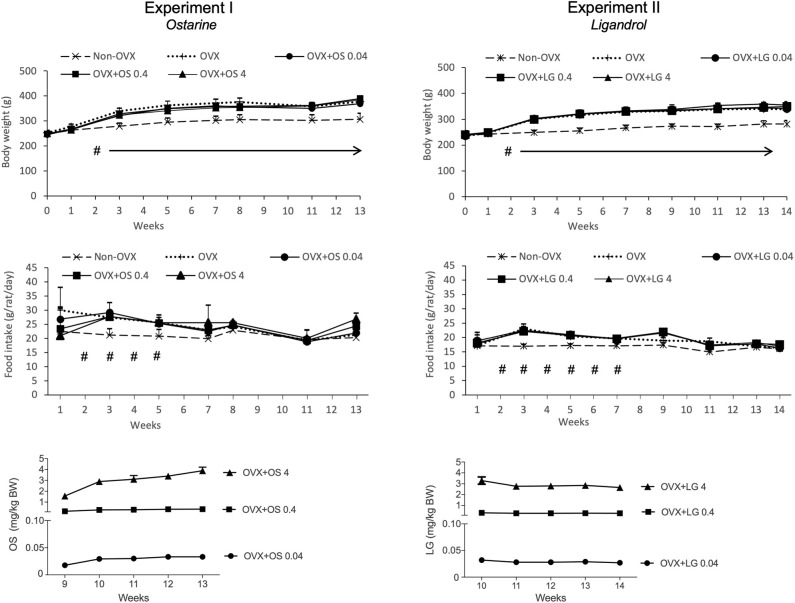
Figure 2.
Body weight (g), daily food intake (g/rat/day) and daily intake of OS or LG (mg/kg BW) in both experiments. Data of Experiment I has been partly published (32, 33). #p < 0.05 Non-OVX vs. all the other groups, arrows: BW in Non-OVX group differs significantly from the other groups from week 2 until the end of the study (p < 0.05, Tukey-Test).

