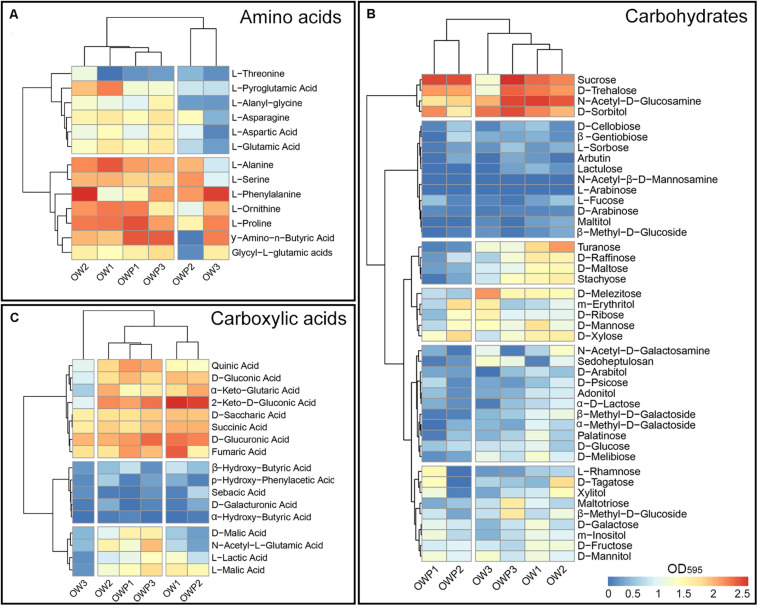
FIGURE 1.
Heatmaps for the carbon utilization patterns of the substrates from the Biolog FFPlates data incubated for 120 h from soil samples: (A) Amino acids. (B) Carbohydrates. (C) Carboxylic acids (n = 3). Legend: high substrate utilization activities (red), low substrate utilization activities (blue).

