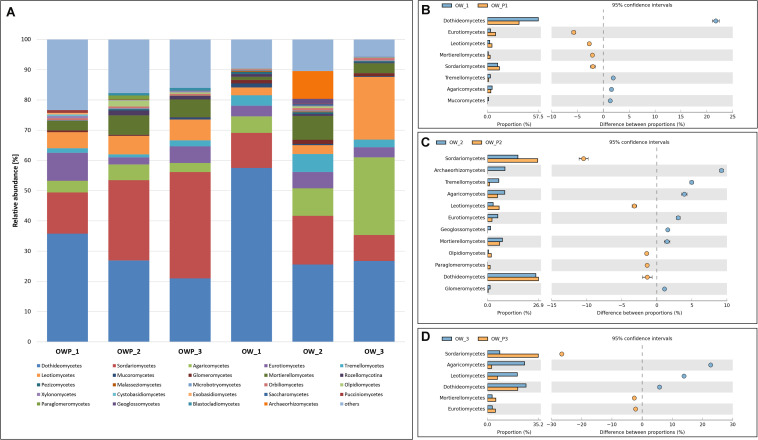
FIGURE 3.
Relative abundance of dominant fungal classes in the different soil samples (percentage of sequences) based on next generation sequencing. Classifications with less than 1% abundance are gathered into the category “other.” (A) Class composition by sampling site. (B) Comparison of dominant classes between OW1 and OWP1. (C) Comparison of dominant classes between OW2 and OWP2. (D) Comparison of dominant classes between OW3 and OWP3.

