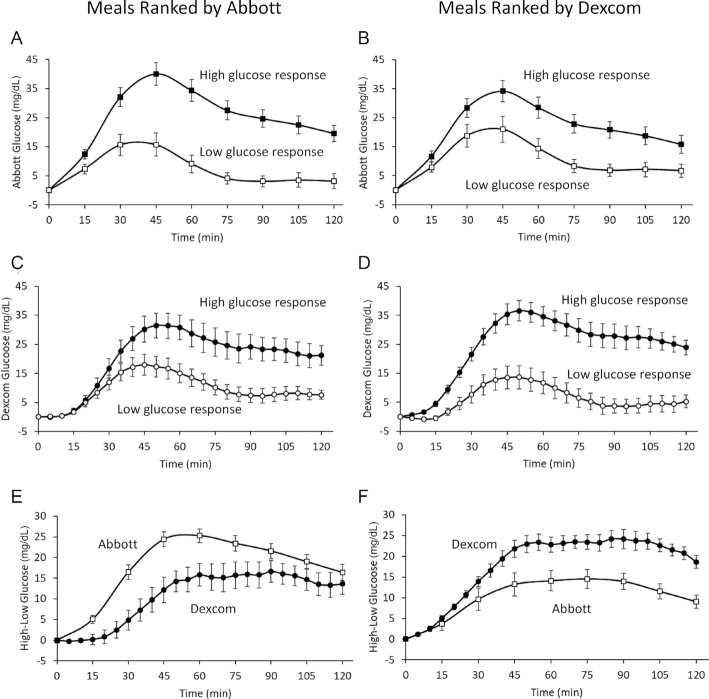
Figure 2.
Mean Abbott glucose responses (A) to the high- compared with the low-ranked half of 760 ad libitum meals according to the Abbott system. Mean Abbott glucose responses (B) in the same 16 subjects to the same high-ranked compared with the low-ranked meals according to the Dexcom system. Mean Dexcom glucose responses (C) to the meals ranked as high glycemic compared with those ranked as low glycemic by the Abbott system. Mean Dexcom glucose responses (D) to the meals ranked as high glycemic compared with those ranked as low glycemic by the Dexcom system. Difference between the Abbott- and Dexcom-measured glucose responses (E) for the meals ranked as high glycemic compared with those ranked as low glycemic by the Abbott system. Difference between the Abbott- and Dexcom-measured glucose responses (F) for the meals ranked as high glycemic compared with those ranked as low glycemic by the Dexcom system.

