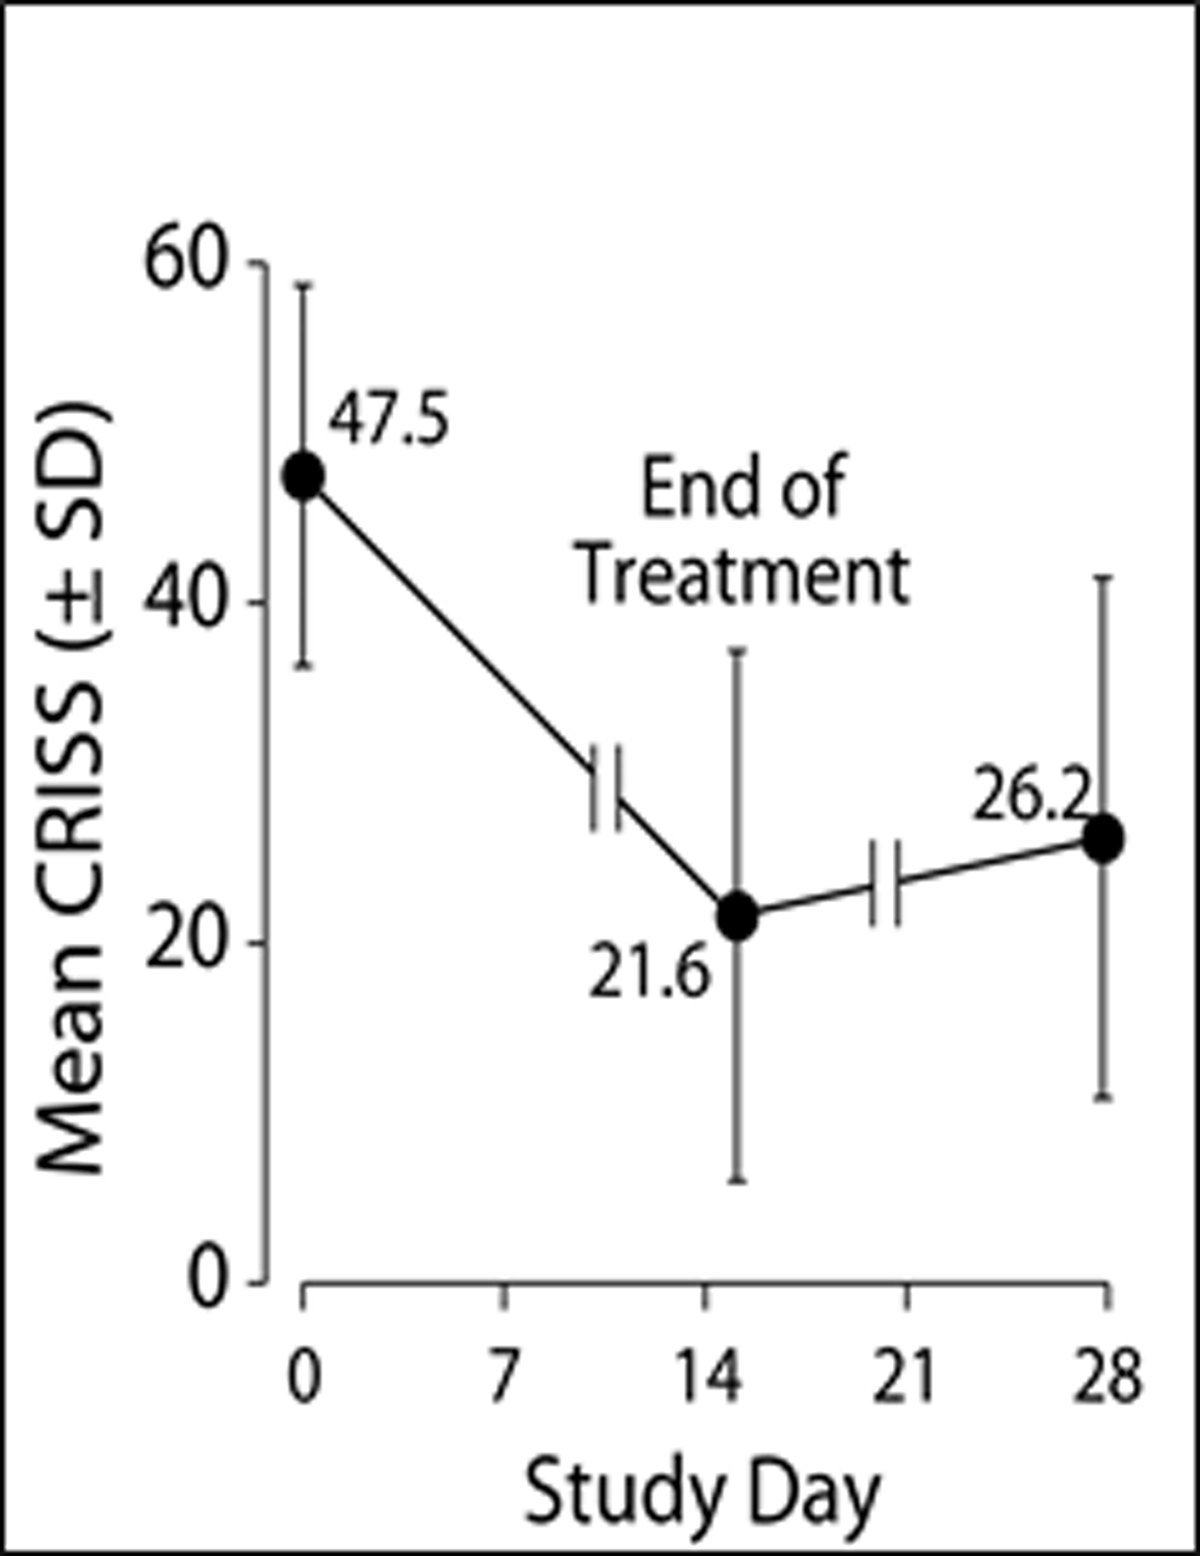
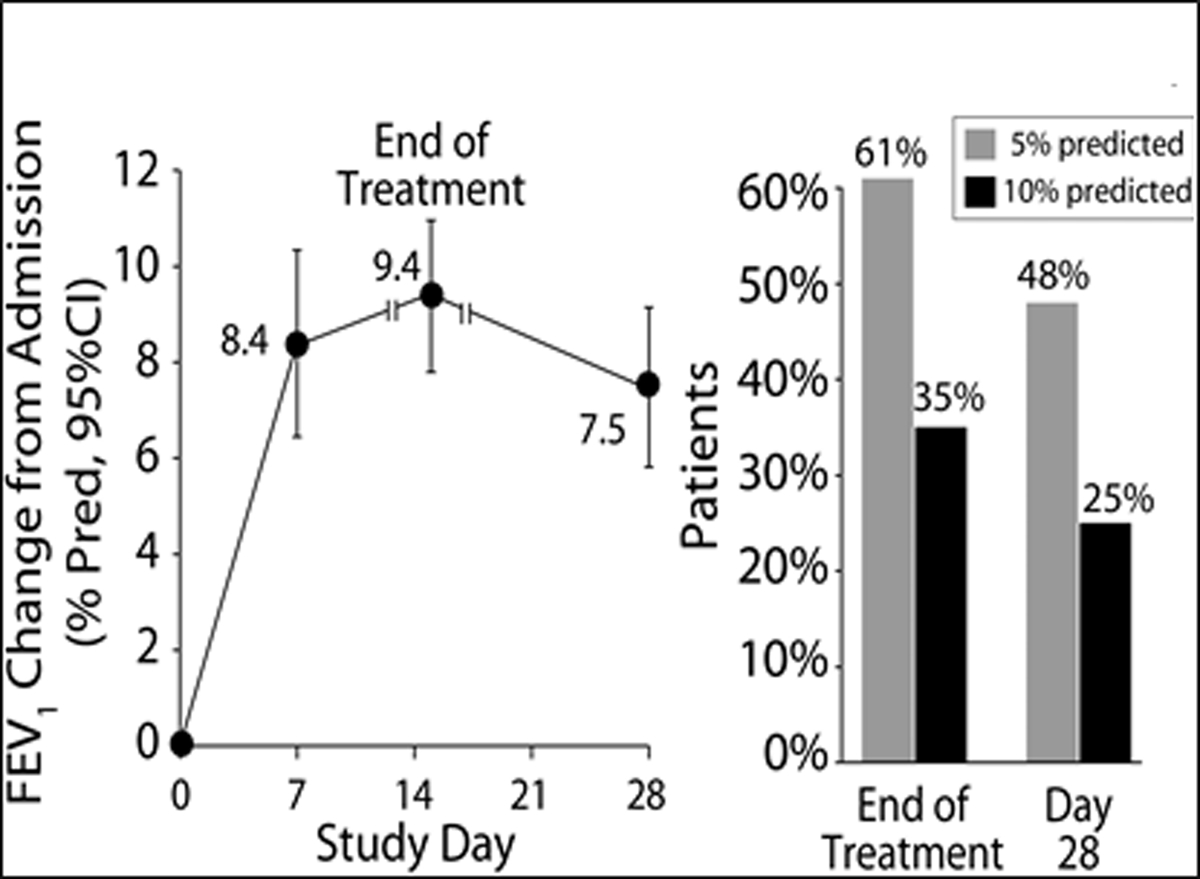
Figure 2a and 2b.


2a: Patient’s mean the Chronic Respiratory Infection Symptom Score (CRISS) +/− SD by day of treatment with day 0 the beginning of IV treatment. The CRISS ranges from 0–100 with 100 being the worst possible respiratory symptoms. 2b: notes the FEV1 % predicted change from admission for IV antibiotics by days of treatment. The bar graph notes those with an absolute change of 5% predicted and 10% predicted by end of IV treatment and them by day 28.
