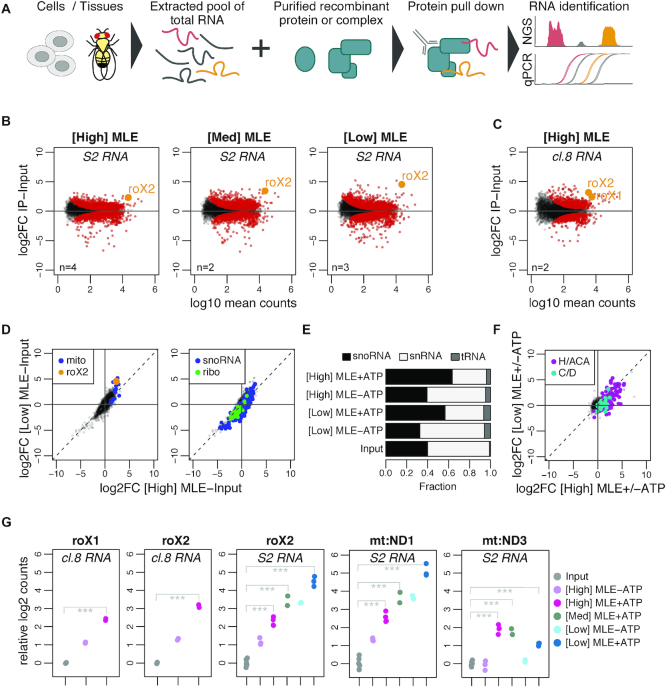
Figure 1.
vitRIP provides a comprehensive in vitro transcriptome binding profile of the DExH helicase MLE. (A) Schematic representation of the vitRIP strategy. (B) Log2 fold change (log2FC) of S2 RNA in MLE vitRIP relative to input in relation to log10 mean RNA-seq read counts. vitRIP was performed with a constant concentration of total S2 RNA and an MLE protein concentration series of [High] = 50 nM, [Med] = 20 nM and [Low] = 5 nM. Reactions contained ATP. Red: significant RNAs (P < 0.01); orange: selected significant RNA; n: number of biological replicates. Differential analysis of the individual comparisons is given in Supplementary Table S1. (C) vitRIP analysis as in (B), but with [High] = 50 nM MLE and total cl.8 RNA. (D) Scatter plots comparing the log2FC of S2 RNA in vitRIP with [High] MLE and [Low] MLE relative to input. Reactions contained ATP. roX2 and mitochondrial RNAs (mito) are highlighted on the left plot, small nucleolar RNAs (snoRNA) and ribosomal protein-coding RNAs (ribo) on the right plot. Enrichment analysis of RNA classes is given in Supplementary Table S2. (E) Bar plot displaying the fraction of snoRNA, snRNA and tRNA RNA-seq read counts in input and MLE vitRIP with S2 RNA in absence or presence of ATP. The sum of snoRNA, snRNA and tRNA read counts constitute on average 1% of all mapped RNA-seq reads. (F) Scatter plot comparing vitRIP of [High] MLE and [Low] MLE with S2-RNA in presence of ATP relative to absence of ATP. Box H/ACA and box C/D snoRNAs are highlighted. Enrichment analysis of RNA classes is given in Supplementary Table S2. (G) Dot plot representing enrichment of roX1, roX2, mt:ND1 and mt:ND3 in MLE vitRIP with RNA derived from cl.8 or S2 cells, in absence or presence of ATP. Log2 counts relative to input are displayed; ***P < 0.001. Differential analysis of individual comparisons is given in Supplementary Table S1.

