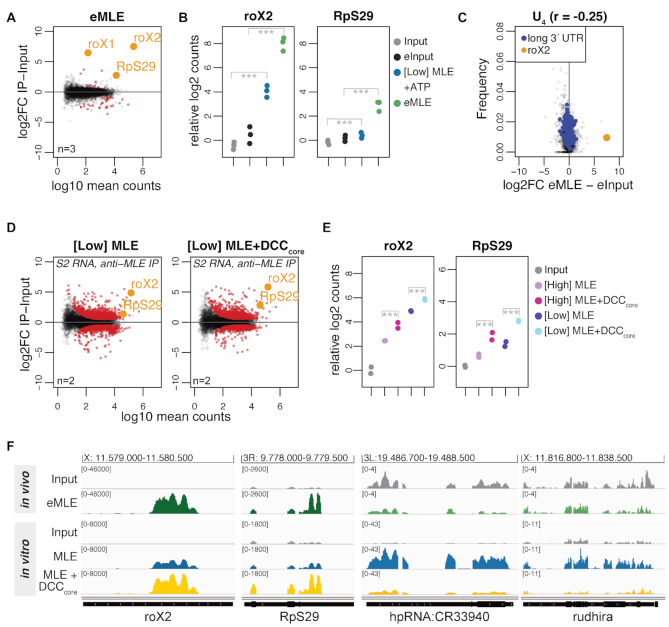
Figure 3.
The DCCcore modulates the intrinsic RNA binding specificity of MLE. (A) Log2 fold change (log2FC) of RNA recovered from S2 extracts in RNA immunoprecipitation (RIP) with endogenous MLE (eMLE) relative to input in relation to log10 mean counts. Red: significant RNAs (P < 0.01); orange: selected significant RNAs; n: number of biological replicates. (B) Dot plot representing roX2 and RpS29 enrichment in eMLE RIP from S2 extracts and in [Low] MLE vitRIP with S2 RNA, respectively. Log2 counts relative to input are displayed; ***P < 0.001. Differential analysis of the individual comparisons is given in Supplementary Table S1. (C) Comparison of U4 frequency and log2FC of RNA in eMLE RIP from S2 cells relative to input. roX2 and pre-mRNAs with a 3′ UTR longer than 2027 bp (top 5%) are highlighted. Spearman's correlation (r) was calculated for all datapoints. (D) Log2FC of S2 RNAs in vitRIP with [Low] MLE relative to input in absence (left) or presence (right) of recombinant DCCcore, in relation to log10 mean counts. MLE vitRIP was performed with a monoclonal anti-MLE antibody. The DCCcore comprises the subunits MSL1, MSL2, MSL3 and MOF. Red: significant RNAs (P < 0.01); orange: selected significant RNAs; n: number of biological replicates. (E) Dot plot representing roX2 and RpS29 enrichment with [High] or [Low] MLE in vitRIP with S2 RNA in absence or presence of recombinant DCCcore. Log2 counts relative to input are displayed; ***P < 0.001. Differential analysis of the individual comparisons is given in Supplementary Table S1. (F) Genome browser views of representative in vivo and in vitro binding profiles of MLE on roX2, RpS29, hpRNA:CR33940 and rudhira in comparison to input. Genomic coordinates for each region are given above the graph.

