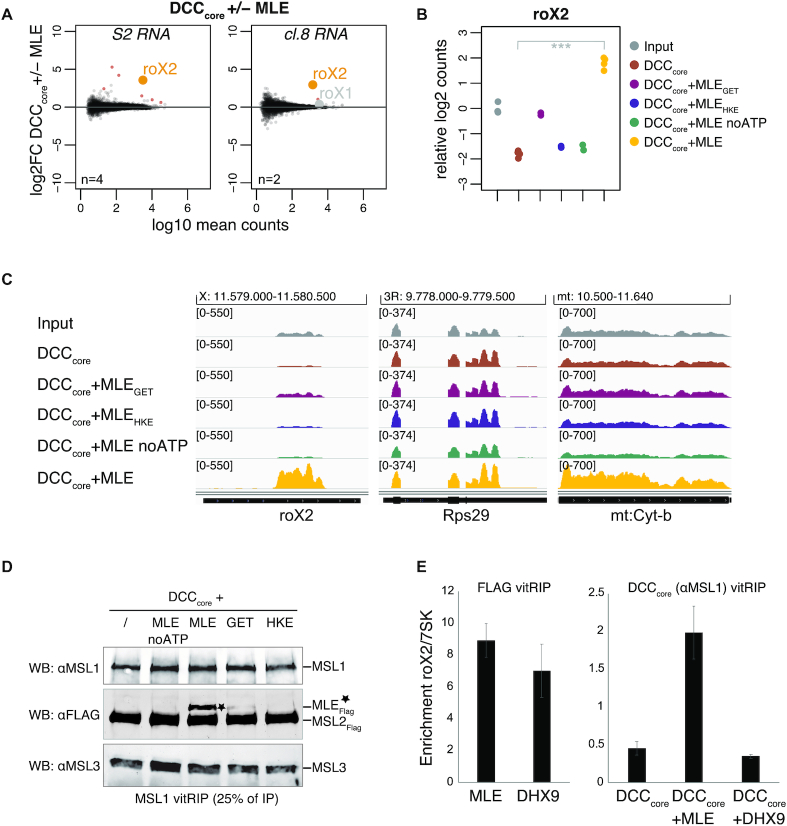
Figure 4.
Specific roX2 association with the DCC depends on Drosophila MLE. (A) Log2 fold change (log2FC) of RNA from S2 (left) or cl.8 cells (right) in vitRIP with the DCCcore in presence or absence of [Low] MLE in relation to log10 mean counts. Reactions contained ATP. vitRIP of the DCCcore employed an anti-MSL1 antibody. Red: significant RNAs (P < 0.01); orange: selected significant RNA; gray: selected non-significant RNA; n: number of biological replicates. (B) Dot plot showing log2 counts of roX2 relative to input in DCCcore vitRIP with S2 RNA in absence or presence of MLE variants and ATP unless indicated. vitRIP of the DCCcore utilized an MSL1 antibody. Analyzed variants are MLEGET (MLEK413E) and MLEHKE (MLEH1032E-K1033E). ***P < 0.001. Differential analysis of the individual comparisons is given in Supplementary Table S1. (C) Genome browser views of representative in vitro binding profiles of the DCC shown in (B) on roX2, RpS29 and mt:Cyt-b in comparison to S2 input. Genomic coordinates for each region are given above the graph. (D) Western blot analysis of the integrity of the DCC in MSL1 vitRIP samples shown in (B) and (C). 25% of each immunoprecipitate was analyzed using MSL1, MSL3 and FLAG antibodies. The anti-FLAG antibody detects FLAG-tagged MSL2 and MLE variants (indicated by asterisk). (E) Left: FLAG vitRIP of FLAG-tagged [High] MLE and [High] DHX9, respectively, with S2 RNA. Right: DCCcore vitRIP using an anti-MSL1 antibody with S2 RNA in absence or presence of [Low] MLE and [Low] DHX9, respectively. Enrichment of roX2 relative to 7SK was analyzed by RT-qPCR. Error bars represent standard deviation for two independent replicates. Statistical analysis of RT-qPCR is given in Supplementary Table S3.

