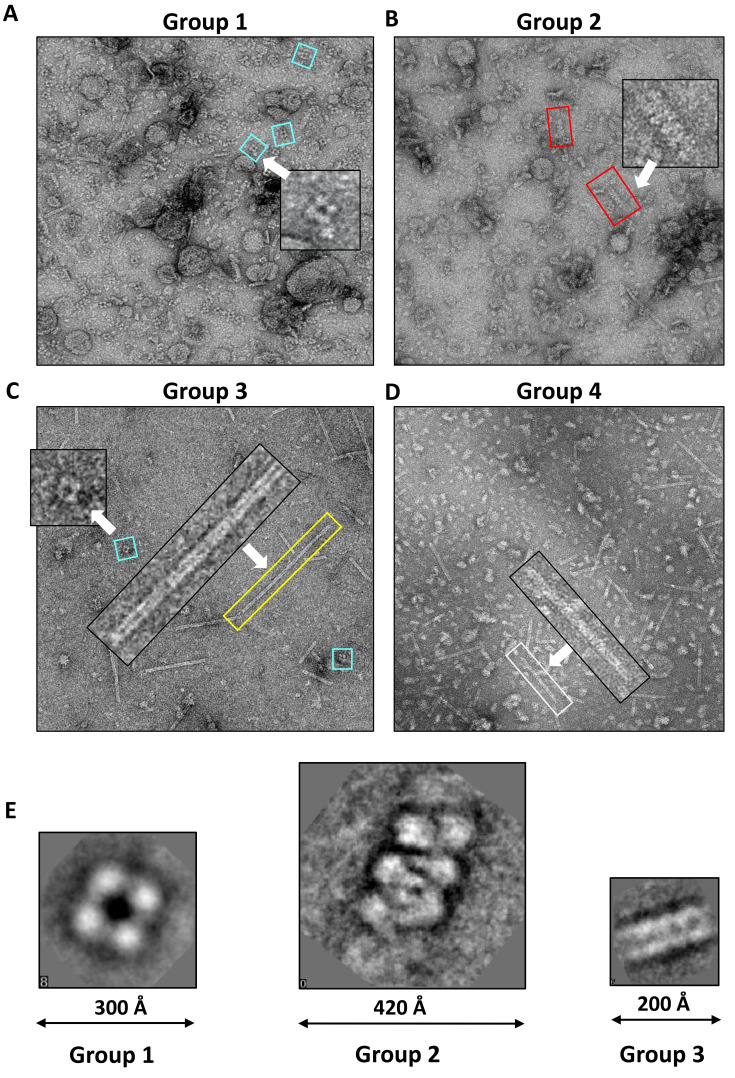
Fig. 3. Representative negative-EM micrographs and 2D classes of endogenous macromolecular architectures.
Representative micrographs of Group 1 (A), Group 2 (B), Group 3 (C), and Group 4 (D). White arrows indicate proteins having prominent architectures, which are enlarged within the boxes. (E) Three representative 2D class averages of the distinct architectures from the micrographs collected using the samples in Groups 1, 2, and 3.

