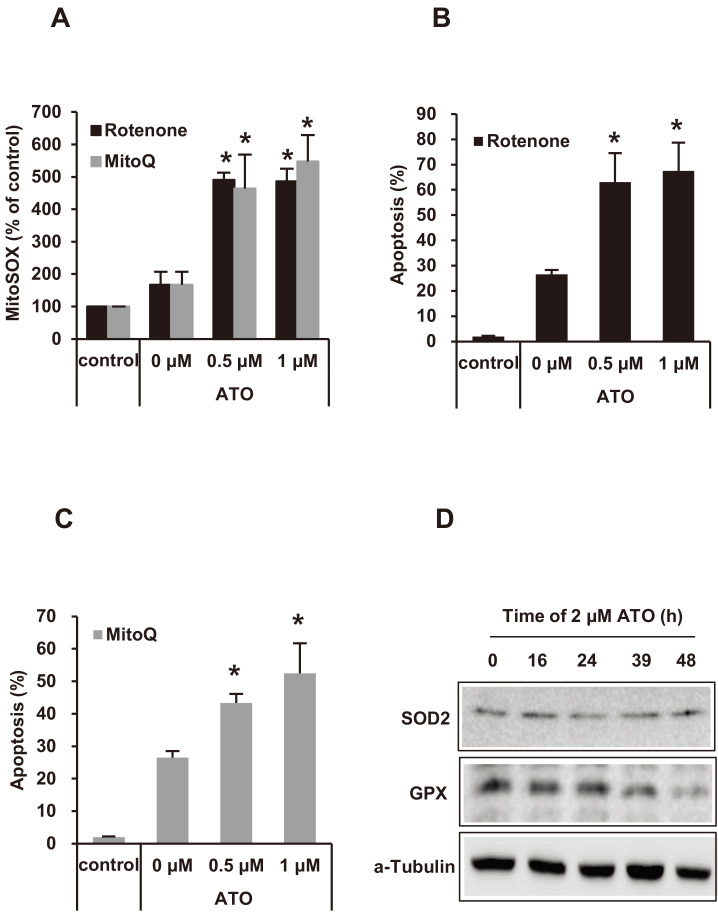
Fig. 3. The incremental level of mitochondrial superoxide (mitoSOX) and the apoptotic fraction of NB4 cells treated with ATO.
(A) MitoSOX level of NB4 cells was increased after 2 μM of ATO co-treatment with the indicated concentrations of rotenone or mitoQ for 24 h. (B and C) Apoptotic cell fraction was increased after 2 μM of ATO co-treatment with the indicated concentraions of rotenone or mitoQ for 24 h. Experiments were presented as mean ± SD. *P < 0.05 vs rotenone or mitoQ non-treated baseline in ATO treatment. (D) The expression levels of SOD2 and GPX were detected by western blot assay after 2 μM of ATO treatment for the indicated times. α-Tubulin was used as a loading control.

