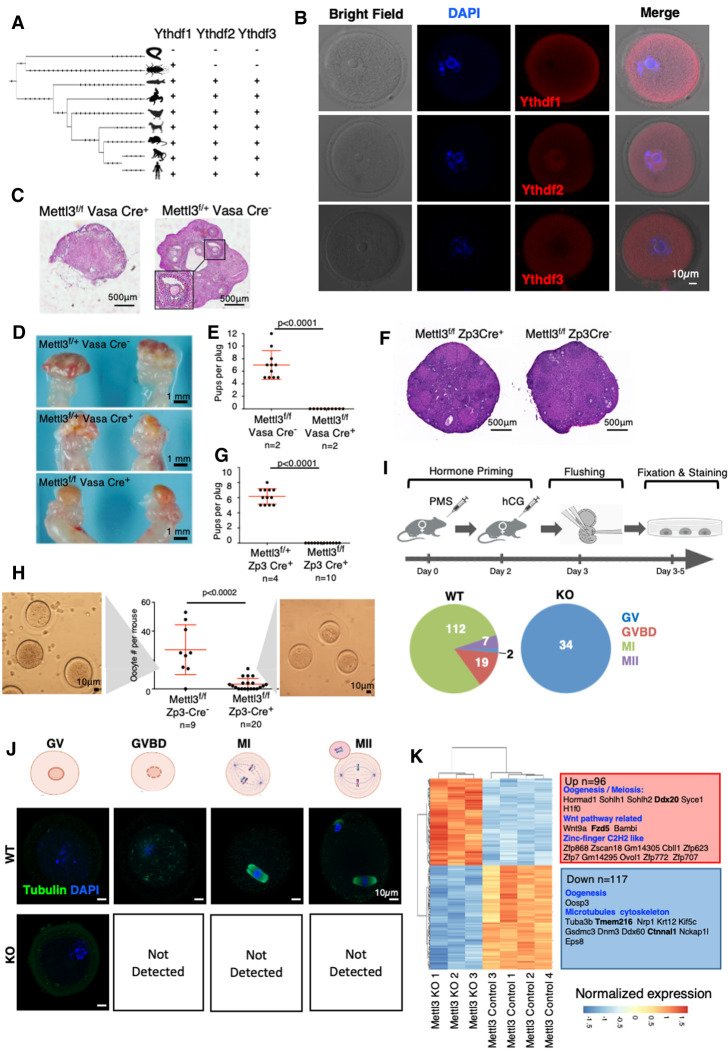
Figure 1.
Mettl3 is essential for female mice fertility. (A). Phylogenetic tree of the protein sequences of Ythdf1, Ythdf2 and Ythdf3, based on UCSC database. The three readers appeared together in vertebrates, possibly after whole genome duplication. (B) Immunostaining of Ythdf1, Ythdf2, and Ythdf3 in ICR wild-type (WT) oocytes. (BF) Bright field. (C) H&E staining of ovaries, showing normal follicle structure in Mettl3f/f VasaCre− control, and a severe abnormality in Mettl3f/f VasaCre+ females. (D) Gross morphology of Mettl3f/fVasaCre+ and control female ovaries. Cre+ females show a smooth shape that lacks the typical follicular morphology. (E) Number of pups per plug produced by mating Mettl3f/f Vasa Cre+ females, compared with Mettl3f/f Vasa Cre− control females. The fathers in both cases were WT. A significant difference between Cre+ and Cre− female fertility is observed (P < 0.0001, Mann–Whitney test). (F) H&E staining of ovaries, showing normal morphology both in Mettl3f/f Zp3 Cre− and Mettl3f/f Zp3 Cre+ ovaries. (G) Number of pups per plug produced by mating a Mettl3f/f Zp3 Cre+ female, compared with a Mettl3f/+ Zp3 Cre+ control female. The fathers in both cases were WT. A significant difference between f/f and f/+ female fertility is observed (P < 0.0001, Mann-Whitney test). (H) Number of oocytes per mouse flushed from Mettl3f/f Zp3 Cre+ females, compared with Mettl3f/f Zp3 Cre− control females. A significant difference between the number of oocytes of Mettl3f/f ZP3 Cre+ and Mettl3f/f ZP3 Cre− is observed (P < 0.0002, Mann–Whitney test). (I, top) Experimental design – Mett3f/f Zp3 Cre+ and Cre− as control underwent hormone priming, oocyte flushing, fixation, and staining for tubulin. (Bottom) Number of oocytes observed in the different stages of meiosis. In the control, most of the oocytes were in MI stage, in KO (Cre+) all of the observed oocytes were in the GV state. (J) Staining examples of oocytes in the different stages of meiosis as observed in KO (Cre+) and control (Cre−). (K) Differentially expressed genes between Mettl3f/f Zp3 Cre− (control) and Mettl3f/f Zp3 Cre+ (KO) oocytes, along with selected enriched categories. m6A methylated genes appear in bold. Ninety-six genes are up-regulated in the KO, and 117 are down-regulated in the KO.

