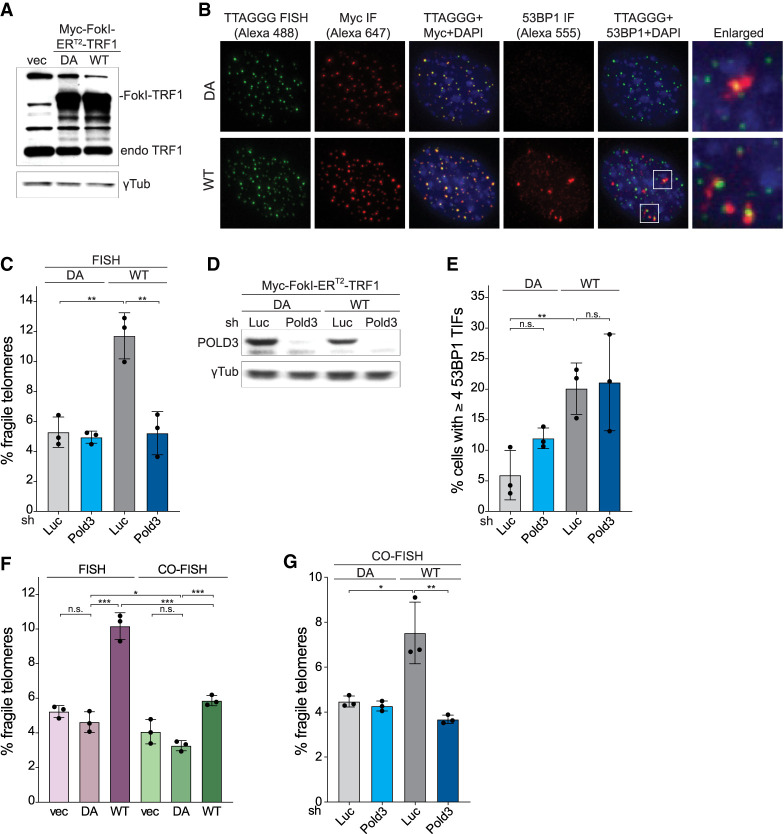
Figure 4.
BIR mediates fragile telomeres formation in cells with telomeric DSBs. (A) Western blot analysis of Myc-FokI-ERT2-TRF1 expression in wild-type MEFs infected with empty vector, nuclease-dead (DA), or wild-type (WT) Myc-FokI-ERT2-TRF1. γ-Tubulin serves as the loading control. (B) Immunofluorescence (IF)-FISH analysis of MEFs expressing DA or WT Myc-FokI-ERT2-TRF1. Telomeres were detected by FISH with an Alexa 488-[TTAGGG]3 probe. The FokI-ERT2-TRF1 alleles were detected with anti-Myc antibodies and Alexa 647 secondary antibodies and 53BP1 with anti-53BP1 antibodies and Alexa 555 secondary antibodies. DNA was stained with DAPI. Images were false colored for presentation purposes. (C) Quantification of q arm fragile telomeres detected by FISH in cells expressing DA or WT Myc-FokI-ERT2-TRF1 after shRNA knockdown of Luc or POLD3 (96 h). (D) Western blot to monitor POLD3 knockdown with shRNA (96 h) in cells expressing DA or WT Myc-FokI-ERT2-TRF1. γ-Tubulin serves as the loading control. (E) Quantification of the TIF response in cells expressing DA or WT Myc-FokI-ERT2-TRF1 after shRNA knockdown of POLD3. Cells were induced with 4-OHT for 24 h before fixation. Data are means ± SD of three independent experiments of >50 nuclei each. (F) Quantification of q arm fragile telomere frequency in cells expressing DA or WT Myc-FokI-ERT2-TRF1 by FISH and CO-FISH. Cells were treated with 4-OHT for 24 h before harvesting for metaphase analysis. (G) Quantification of q arm fragile telomeres detected by CO-FISH in cells expressing DA or WT Myc-FokI-ERT2-TRF1 after shRNA knockdown of Luc or POLD3 (96 h). For all fragile telomere analyses, data are means ± SD of three independent experiments of ∼2000 telomeres analyzed per experiment. All P-values in this figure were derived from two-tailed unpaired t-test. (***) P ≤ 0.001, (**) P ≤ 0.01, (*) P ≤ 0.05, (n.s.) P > 0.05.

