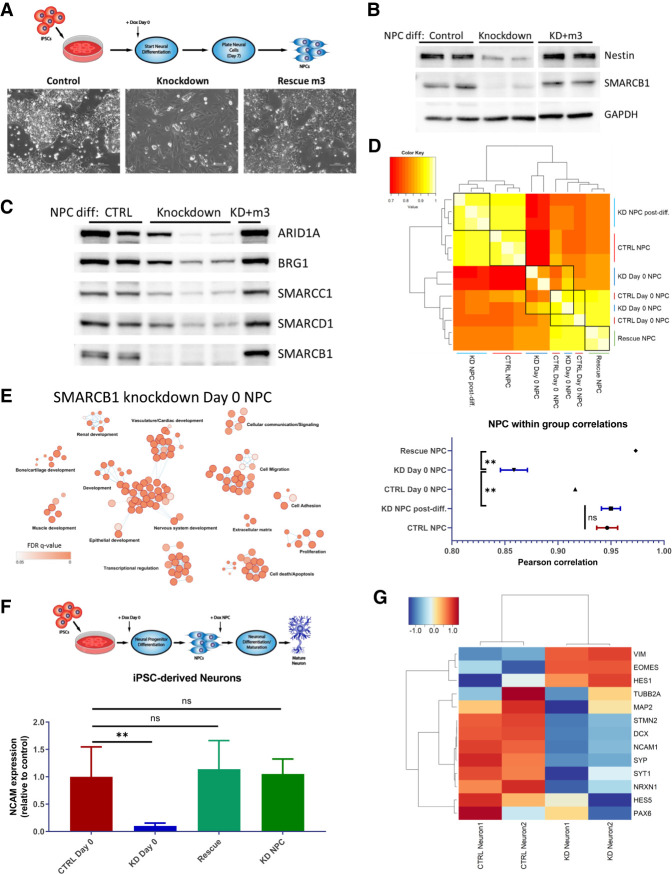
Figure 4.
SMARCB1 loss throughout neural differentiation leads to aborted differentiation and a lack of stability in resulting neural progenitor cells. (A, top) Schematic of directed differentiation of iPSCs into neural progenitor cells, with doxycycline induction at day 0. (Bottom) Phase contrast images at 20× magnification of resulting NPC morphology at days 10–14 of protocol. (B) Western blot showing protein expression of SMARCB1, neural marker Nestin, and control GAPDH in control, SMARCB1 knockdown, or rescue NPCs differentiated in the presence of doxycycline. (C) Western blot of BAF complex subunit protein expression in nuclear lysates of NPCs differentiated in the presence of doxycycline. (D, top). Pearson correlation chart comparing transcriptome similarity between control, knockdown, or rescue NPCs differentiated with or without doxycycline. Black boxes indicate groups being compared. White corresponds to greater correlation and red to lower correlation. (Bottom) Mean within group correlation values with standard error of the mean for each group of NPCs. Within-group correlations were compared using one-way ANOVA with Tukey's multiple comparisons test. (**) Adjusted P-value < 0.01. (E) Gene ontology network of top 500 genes that were differentially expressed in NPCs differentiated with SMARCB1 knockdown relative to controls but not in NPCs with knockdown postdifferentiation relative to controls. Dots represent statistically significant gene ontology terms, clustered based on overlap of the genes contained in each term. Dot size indicates the number of genes included in each term and darker color corresponds to smaller adjusted P-value. Labels indicate the main process making up each cluster. (F, top) Schematic showing directed neuronal differentiation with doxycycline induction either at day 0 or at the NPC state. Control, SMARCB1 knockdown, and rescue neurons differentiated in this manner were assessed for neuronal maturation efficacy by FACS analysis for neuronal surface marker NCAM1. (Bottom) Mean and standard deviation percentages of NCAM-positive cells in postdifferentiation neurons. Comparisons between groups were conducted by one-way ANOVA with Tukey's multiple comparisons test. (**) P-value < 0.01. (G) Heat map of scaled transcript expression of neuronal differentiation markers in control or SMARCB1 knockdown neurons differentiated with day 0 doxycycline. VIM, HES1, HES5, PAX6, and EOMES are markers of less differentiated neural cells. All other genes are markers of committed neurons.

