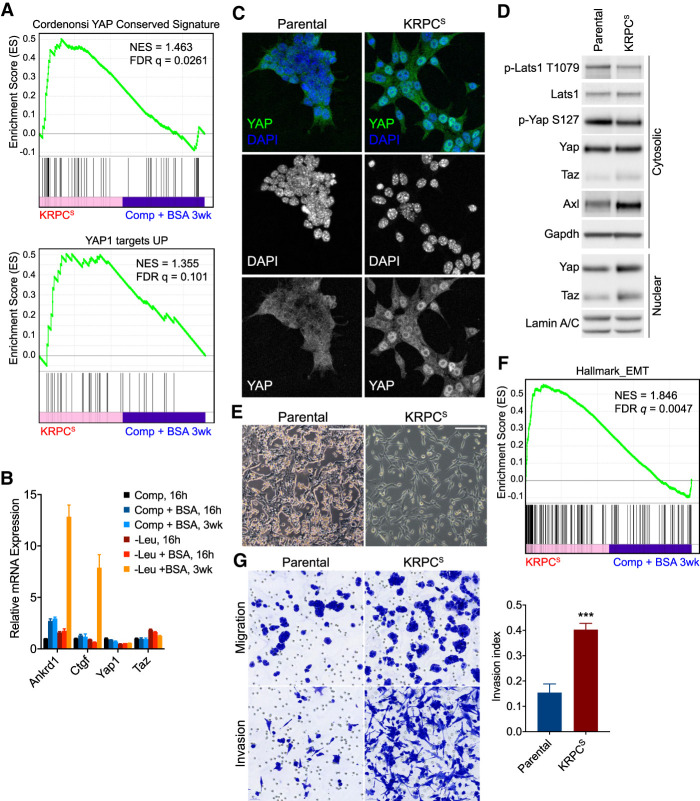
Figure 2.
Increased Yap/Taz transcriptional activity and EMT phenotype in cells selected for extracellular protein-dependent growth. (A) Gene set enrichment analysis (GSEA) plots showing enrichment in expression of Yap target genes, as measured by RNA sequencing of KRPCS cells, relative to expression in KRPC cells cultured for 3 wk in complete medium + 3% BSA. (B) Relative mRNA expression of Yap, Taz, and target genes as measured by qRT-PCR in KRPC cells cultured in ±Leu ±3% BSA for 16 h or 3 wk. Bars represent mean ± SD from three biological replicates. (C) Immunofluorescence micrographs showing localization of Yap (antibody also cross-reacts with Taz) in parental KRPC and KRPCS cells. (D) Immunoblot of cytosolic and nuclear extracts from parental KRPC and KRPCS cells. (E) Phase contrast micrographs of parental KRPC and KRPCS cells. Scale bars = 200 µm. (F) GSEA plot showing enrichment in expression of EMT genes in KRPCS cells, relative to expression in KRPC cells cultured for 3 wk in complete medium + 3% BSA. (G) Light micrographs showing migration of parental or KRPCS cells across control (top panels) or matrigel-coated (bottom panels) membranes. Bar plot represents mean ± SEM of invasion index (ratio of cells that migrated across matrigel membrane to control membrane) across three biological replicates (***) P = 0.0005, unpaired two-tailed t-test.

