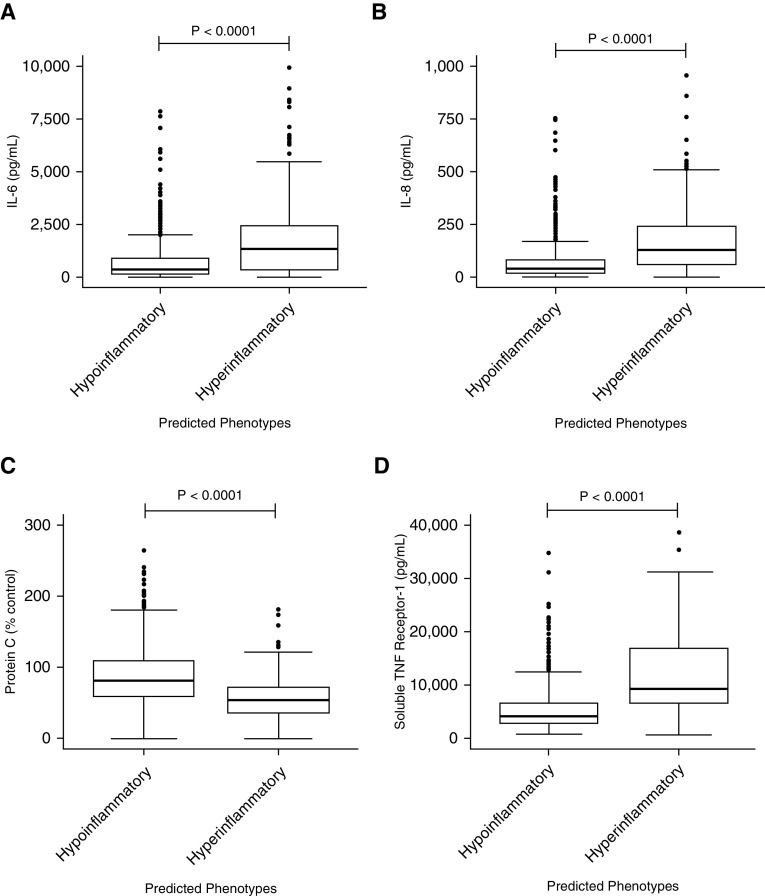
Figure 2.
Differences in the plasma biomarker levels in the validation data set (SAILS [Statins for Acutely Injured Lungs from Sepsis] trial) at baseline in the hypoinflammatory and hyperinflammatory phenotypes as identified by the clinical classifier model developed in the primary analysis. P values represent the Wilcoxon rank sum test. (A) IL-6; y-axis upper limit is restricted to 10,000 with 19 observations censored (15 hyperinflammatory and 4 hypoinflammatory). (B) IL-8; y-axis upper limit is restricted to 1,000 with 31 observations censored (24 hyperinflammatory and 7 hypoinflammatory). (C) Protein C. (D) Soluble tumor necrosis factor receptor 1; y-axis upper limit is restricted to 40,000 with three observations censored (all hyperinflammatory). TNF = tumor necrosis factor.

