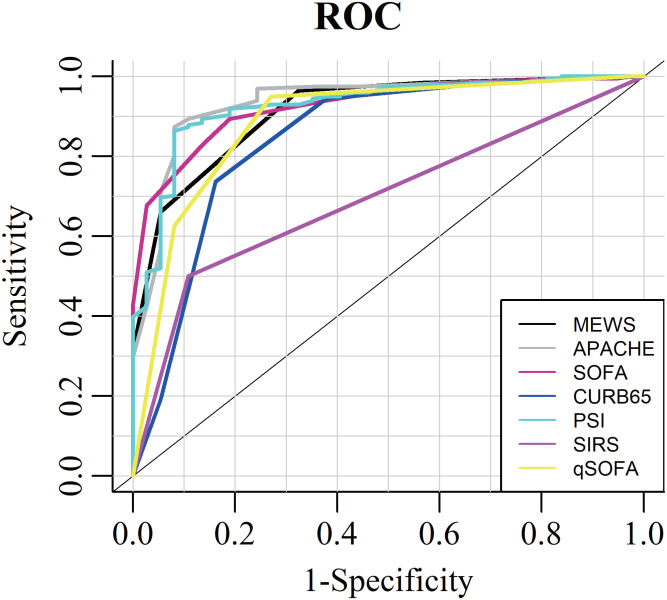
Figure 2. Area under the receiver operating characteristic curve to discriminate in-hospital mortality for MEWS, APACHE II, SOFA, PSI, CURB-65, SISR and qSOFA.
ROC analysis suggested that the capacity of MEWS in predicting in-hospital mortality was as good as the APACHE II, SOFA, PSI and qSOFA, but was significantly higher than SIRS and CURB-65.

