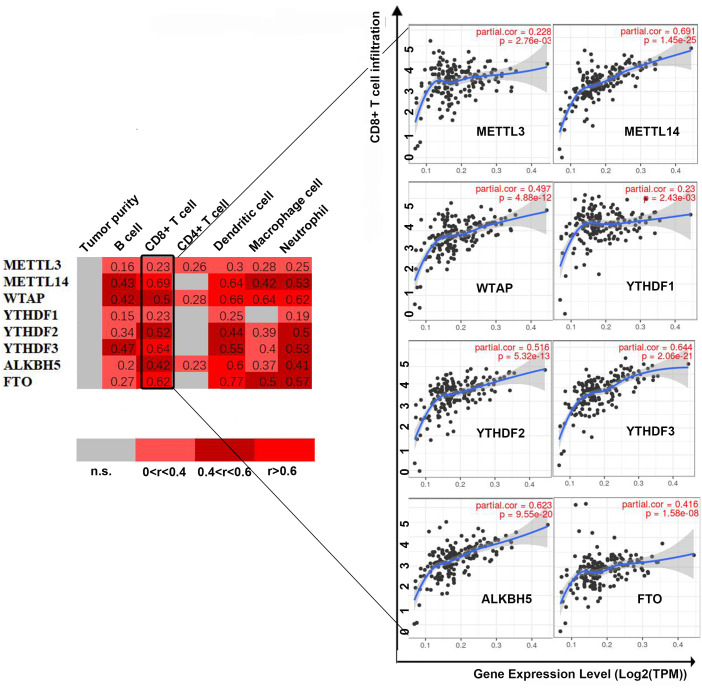
Figure 4. Correlation between infiltrating immune cells and the expression level of m6A-related genes.
The correlation coefficient is labeled “r”. r > 0 indicates that the number of infiltrating immune cells is positively correlated with the gene expression level. We further use color intensity to reflect the correlation strength (0 0.6: level 3).

