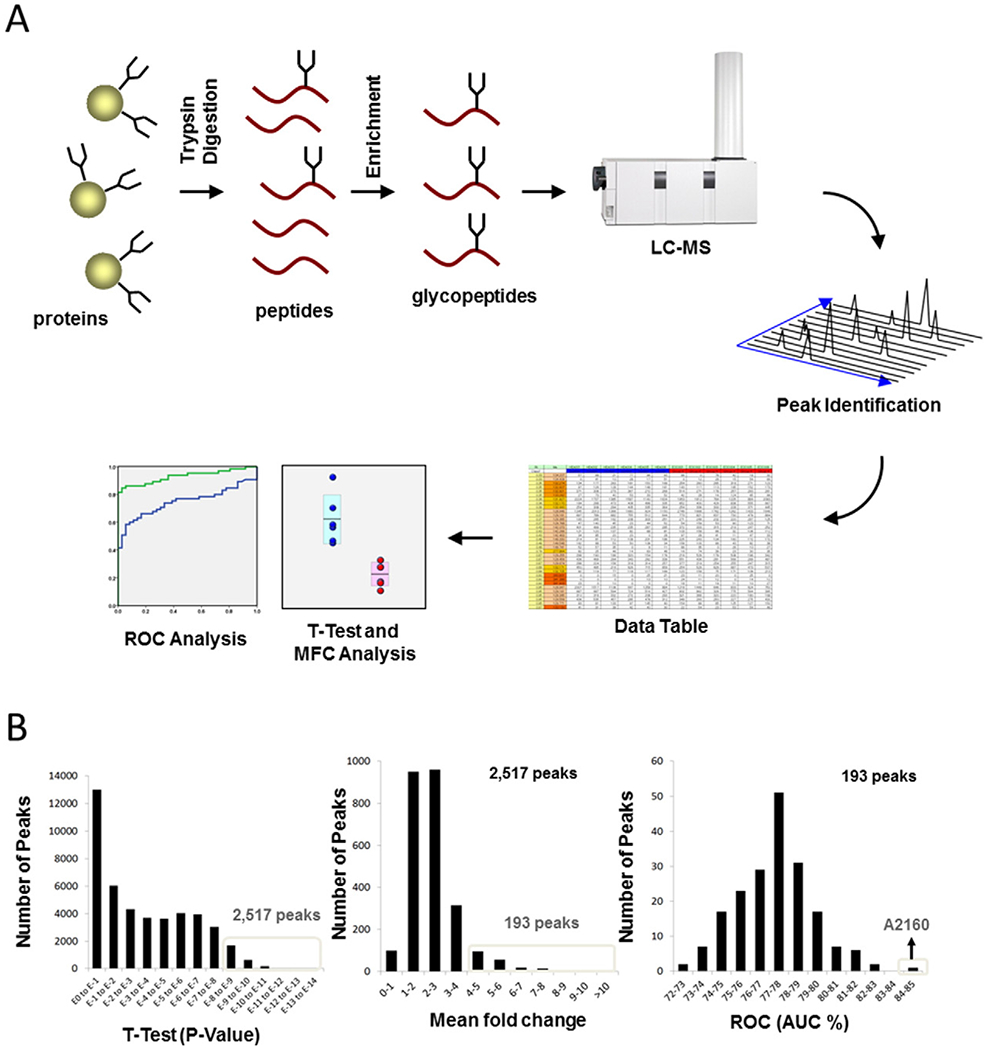
Fig. 1.

Schema of gyloprotein profiling strategy and data mining (A) Glycopeptide profiling strategy is shown. After serum glycoproteins were treated with proteases, glycopeptides were enriched by filtration and AAL lectin column chromatography, and then were analyzed by LC-MS. The position and area of each peak were calculated by our original software. Then all peak areas were normalized to those of a healthy woman (HEA1433), which was set at one unit. A potential new marker of epithelial ovarian cancer (EOC) was identified through investigation of over 100,000 glycopeptide peaks by using t-test, mean fold change (MFC) analysis, and receiver-operator-characteristic (ROC) characteristics analysis for comparison between the EOC and control groups. (B) Data Mining is shown. Glycopeptide A2160 was identified from among more than 100,000 glycopeptide peaks by analysis with t-test (2517 peaks with P < 10−8 compared with controls), MFC analysis (193/2517 peaks with mean values ≥ 4 times those of controls), and ROC analysis (identifying the peak with the highest AUC among 193 peaks).
