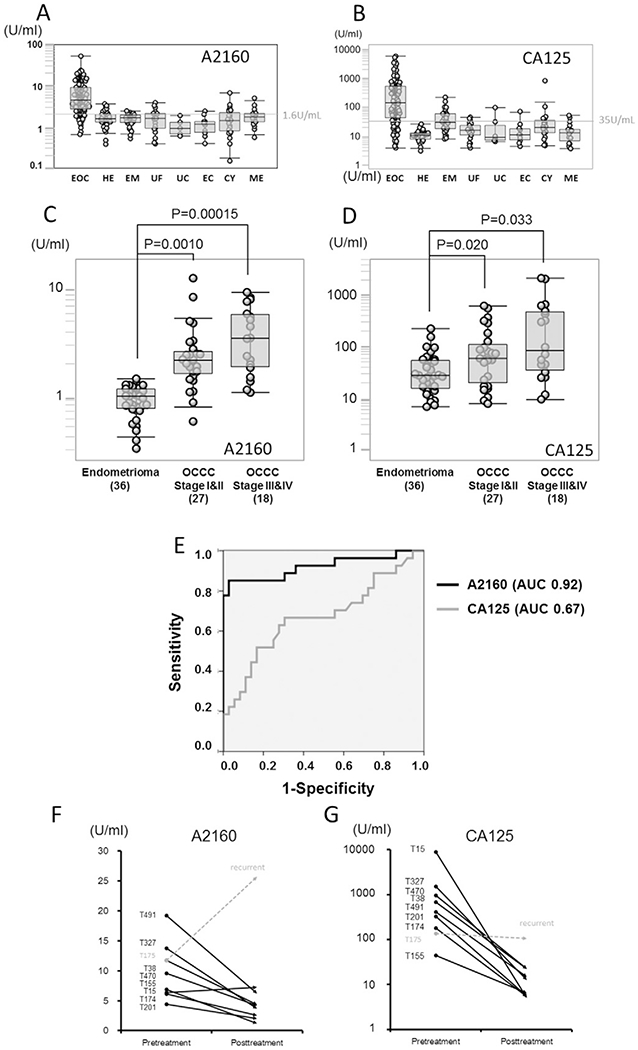
Fig. 2.

Comparison of A2160 and CA-125 levels in diagnosing ovarian cancer (A–B) Box-whisker plots for A2160 and CA-125 levels in healthy subjects and various gynecological diseases are shown. The cut-off value of A2160 was set to maximize the sensitivity and specificity, and was found to be 1.6 U/mL. Superiority of A2160 over CA-125 was demonstrated by comparison of the EOC group and the control group including patients with falsely elevated CA-125 level, especially in endometrioma. The range of CA-125 values (1–10,000 U/mL) in EOC patients was significantly wider than that of A2160 values (1–50 U/mL). EOC: epithelial ovarian cancer, HE: Healthy women, EM: endometrioma, UF: uterine fibroid, UC: uterine cervical cancer, EC: endometrial cancer, CY: ovarian cyst, ME: menstruation. (C–D) A2160 and CA-125 levels are shown for endometrioma, stages I–II OCCC and stage III-IV OCCC. Magnitude ofstatistical significance of A2160 between stages I–II OCCC and healthy subjects (P = 0.001, t-test) was larger than that of CA-125 (P = 0.02). (E) ROC curve analysis of A2160 and CA125 between stages I–II OCCC (n = 27) and endometrioma (n = 36). AUC for A2160 (0.92, 95%CI 0.84–0.99) was markedly larger than AUC for CA-125 (0.67, 95%CI 0.53–0.81) in distinguishing OCCC from endometrioma. (F–G) Interval changes of A2160 and CA125 levels in EOC patients before and one year after treatment are shown. Eight patients with elevated A2160 levels went into remission after tumor resection, and A2160 levels paralleled with CA-125 level. There was one patient (T175) developed EOC recurrence: only A2160 level was elevated at recurrence, and CA-125 levels did not show elevation.
