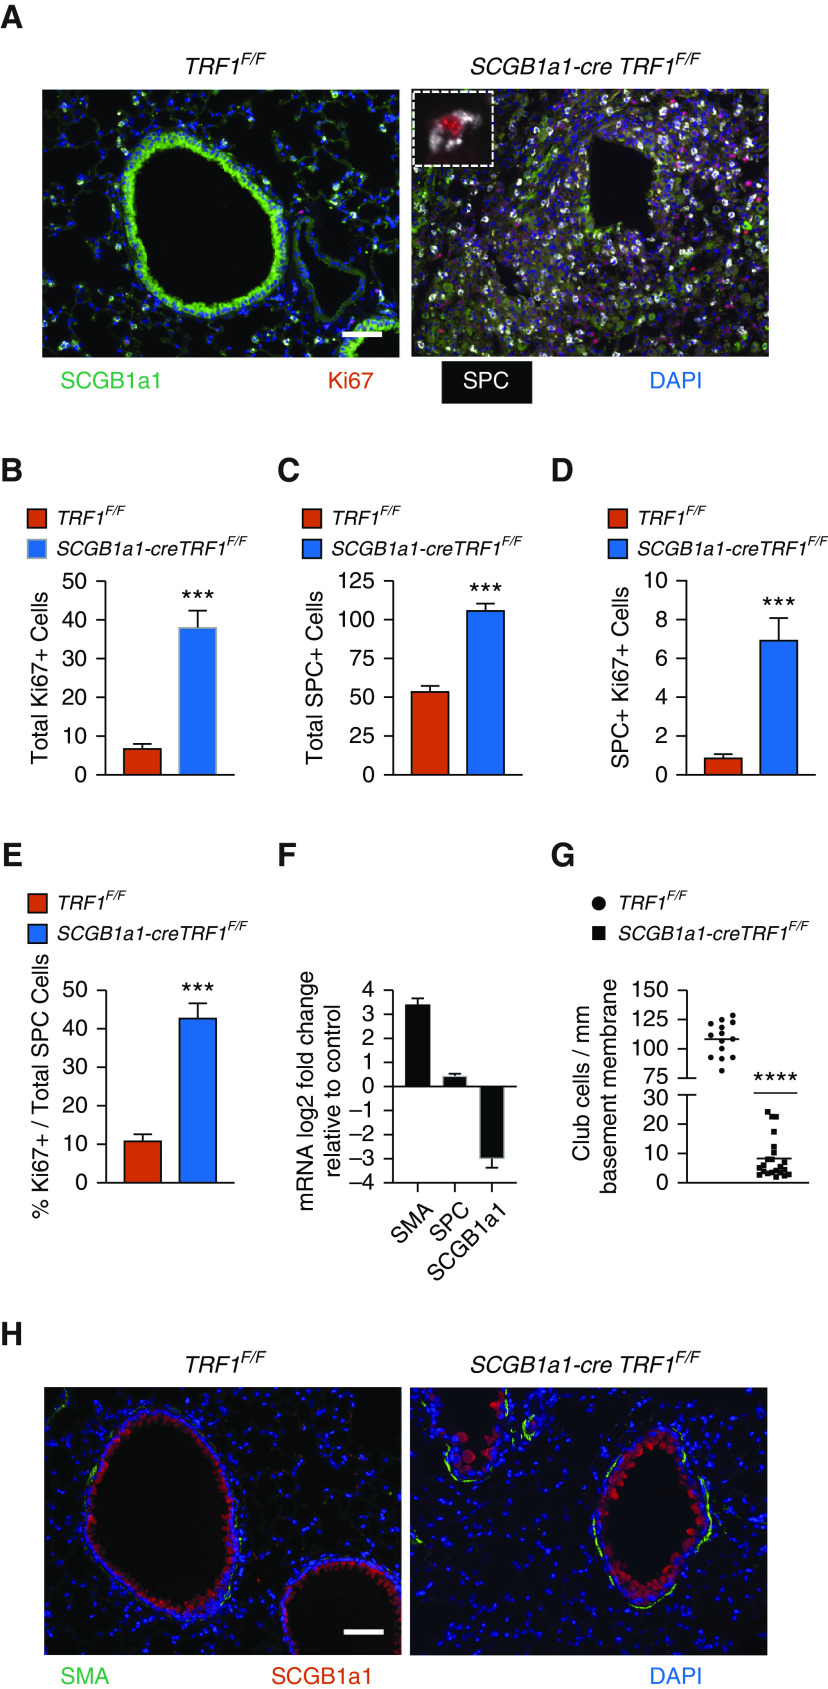
Figure 7.
Loss of club cells and type II alveolar epithelial cell hyperplasia around bronchioles. (A) Immunostaining on lung sections from TRF1F/F and SCGB1a1-creTRF1F/F mice treated with weekly doses of tamoxifen. Cell proliferation marker Ki67 (red), SCGB1a1 (green) for club cells, and SPC (far red changed to white for visibility). Inset: Ki67 marker in an SPC+ cell. Nuclei were stained with DAPI (blue). Scale bar, 50 μm. (B–D) Quantification of total Ki67-positive cells (B), total SPC+ cells (C), and SPC and Ki67 double-positive cells (D). (E) Percentage Ki67+ cells over total SPC-positive cells. ***P < 0.001 (t test). (F) mRNA expression levels in SCGB1a1-creTRF1F/F lungs represented as log2 fold change over TRF1F/F control animals. (G) Quantification of club cells with reference to perimeter of basement membrane, based on multiple random images from a total of five mice per group. N = 5. ****P < 0.0001 (t test). (H) Immunofluorescence staining on paraffin-embedded lung sections costained with α-SMA and SCGB1a1. Scale bar, 50 μm.

