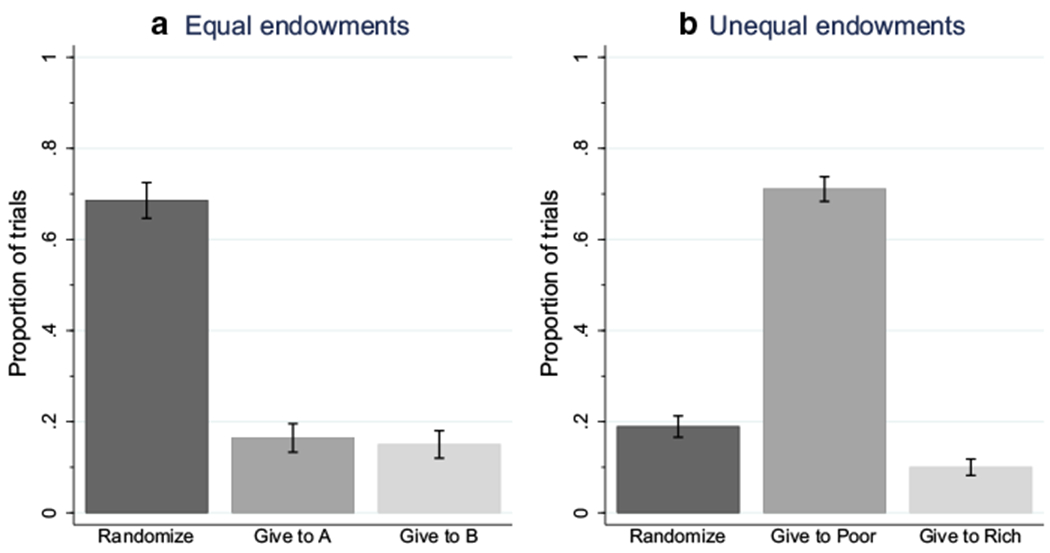
Fig. 4.

Proportions of trials in which allocators chose to randomize or to allocate directly to one of the two potential recipients. Dark gray bars show the proportion of trials in which allocators chose to randomize in the equal endowment conditionss (left panel) and in the unequal endowmenet conditions (right panel). Medium gray bars show the proportion of trials in which allocators chose to allocate directly to Recipient A in the equal endowment conditions (left panel), or to the relatively poorer recipient in the unequal endowment conditions (right panel). Light gray bars show the proportion of trials in which allocators chose to allocate directly to Recipient B in the equal endowment conditions (left panel), or to the relatively richer recipient in the unequal endowment conditions (right panel). Error bars are naïve standard errors, calculated as
