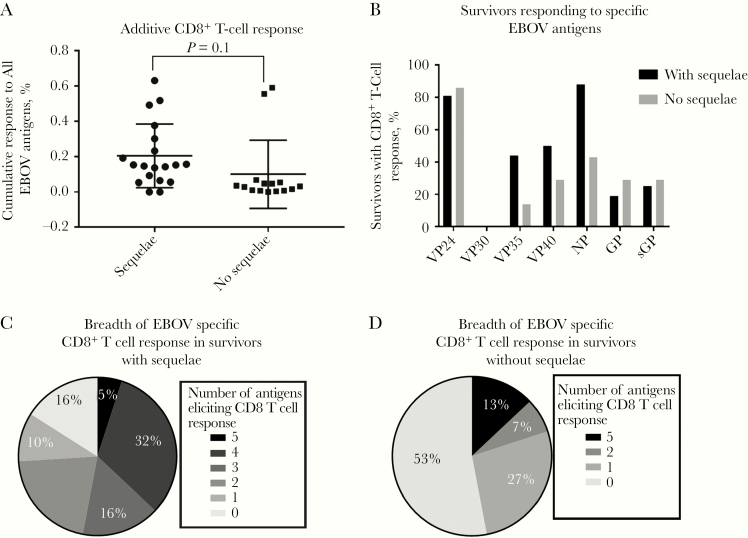
Figure 3.
A, Combined percent of Ebola virus (EBOV)–specific CD8+ T-cell responses to 7 EBOV antigens (nucleoprotein [NP], glycoprotein [GP], soluble glycoprotein [sGP], viral protein [VP] 24, VP30, VP35, and VP40) for each survivor with or without sequelae (P = .1, calculated with Student t test). B, Frequency of survivor response to each EBOV antigen (excluding survivors with no CD8+ T-cell response in the 24-hour overnight assay) (n = 16 with sequelae; n = 7 without sequelae). C, Frequency of survivors with or without sequelae by number of EBOV antigens showing positive CD8+ T-cell response. D, Frequency of survivor response to each EBOV antigen. Survivors with no CD8+ T cell response were excluded from this figure. Survivor with sequelae n = 16; Without sequelae n = 7.

