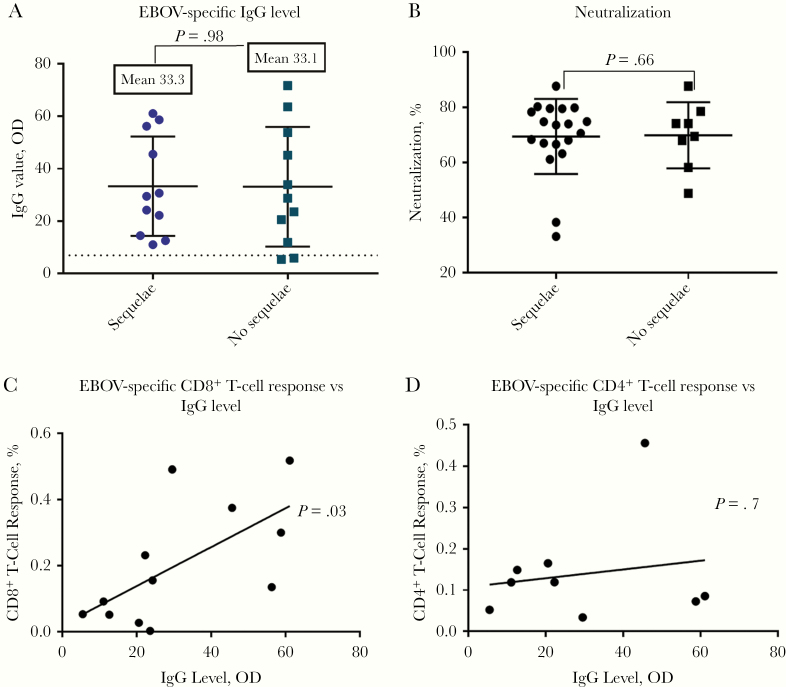
Figure 4.
A, Ebola virus (EBOV)–specific immunoglobulin G (IgG) levels determined using ReEBOV IgG enzyme-linked immunosorbent assay, testing antibodies against viral protein 40 (n = 11 with sequelae; n = 11 without sequelae; P = .98, calculated with Student t test). B, Percentage of neutralization of EBOV antibodies by EBOV glycoprotein pseudotype virus in survivors with (n = 19) or without (n = 8) post-Ebola sequelae (P = .66; Student t test). C, Summed percentage of CD8+ T-cell response to EBOV antigens is significantly parallel to EBOV-specific IgG levels, excluding nonresponders (P = .03; 2-tailed Student t test). D, Summed percentage CD4+ T-cell response to EBOV antigens is not correlated with EBOV-specific IgG values, excluding nonresponders (P = .7; 2-tailed Student t test). Abbreviation: OD, optical density.

