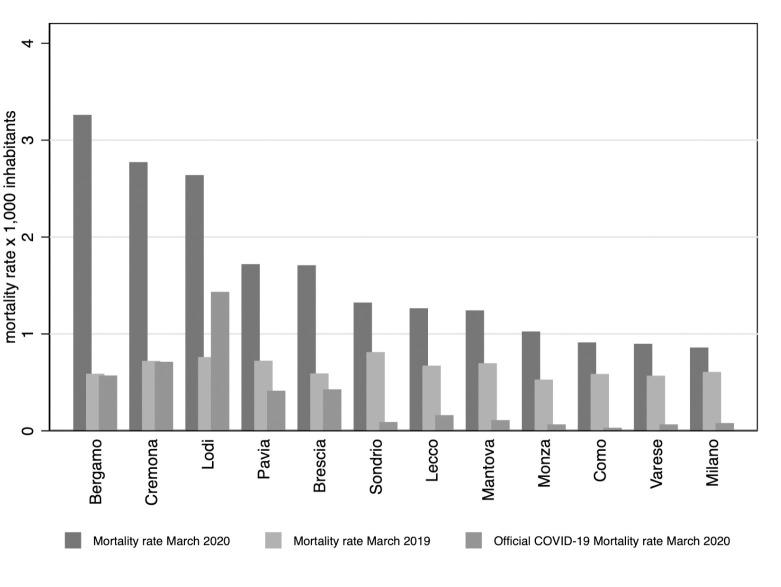
Fig 2. Distribution of mortality rates, by province.
Notes: This graph reports the actual mortality rate in March 2020 and March 2019 as well as the reported mortality rate of COVID-19 as detected by the health authorities, by provinces. Data refer to the month of March until the 28th. These measure are based on our sample of 548 municipalities covering 67% of the regional population.

