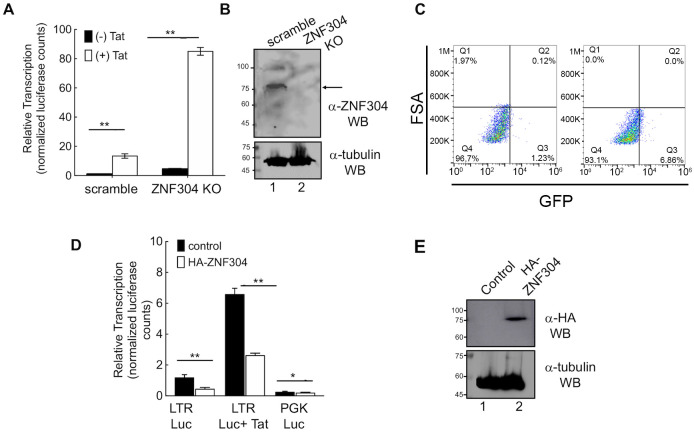
Fig 4. ZNF304 silences HIV gene transcription and modulates viral latency.
A. ZNF304 affects HIV gene transcription–Jurkat cells in which ZNF304 expression was depleted (ZNF304 KO) or control cells that express scramble sgRNA were transduced with HIV-luciferase (LTR-Luc; black bars). For expressing HIV Tat, cells were further transduced with an HIV-Tat-expressing lentivirus (HIV-Luc+Tat; white bars). Luciferase activity was monitored in control and ZNF304 KO cells forty-eight hours post transduction according to the manufacturer’s protocol. Data are presented relative to luciferase readings (normalized to protein levels) in control cells that express scramble sgRNA set to 1. Bar graphs show mean values ± SD of three independent experiments. Asterisks indicate different levels of statistical significance as calculated by a two-tailed Student’s t test (** p≤0.01). B. Western blot analysis for depletion of ZNF304 –Lane 1, control cells expressing scramble sgRNA; Lane 2, ZNF304 KO cells. Protein levels were monitored using ZNF304 IgG. The lower gel represents tubulin western blot, confirming equal protein loading. C. Involvement of ZNF304 in promoting HIV latency– 2D10 T cells were depleted of ZNF304 expression by transducing them with a lentivirus driving the expression of a specific sgRNA that targets ZNF304 and Cas9. GFP expression was monitored by FACS. Data is presented as dot blot showing GFP expression in control and ZNF304 KO cells. D. Overexpression of ZNF304 silences HIV gene transcription–Control (black bars) or Jurkat cells that stably express HA-ZNF304 (white bars) were transduced with a lentivirus that drives the expression of HIV-LTR-Luc HIV, HIV-LTR-Tat-Luc or PGK Luc. Luciferase readings were determined according to the manufacturer’s protocol and normalized to protein concentrations determined by the Bradford method. Western blot analysis confirmed HA-ZNF304 expression using HA IgG. Asterisks indicate different levels of statistical significance as calculated by a two-tailed Student’s t test (*** p≤0.001; * p≤0.1). E. Western blot analysis confirming HA-ZNF304 expression—Lane 1 control cells; Lane 2 cells expressing HA-ZNF304. Western blot was performed with anti-HA IgG. The lower gel represents tubulin expression levels, confirming equal protein loading.

