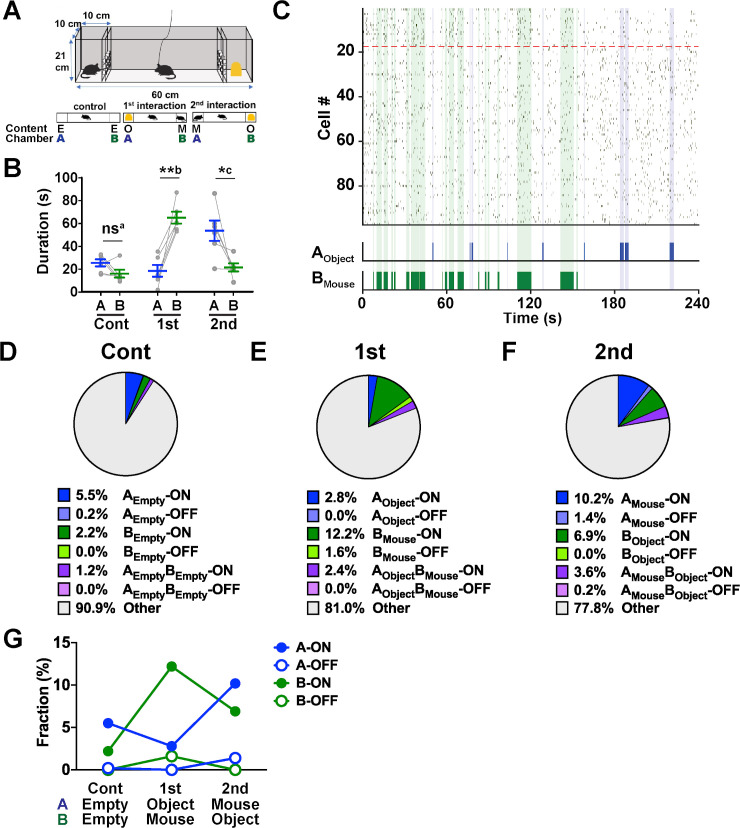
Fig 3. Behavior and AI neuron activity during LC experiments.
(A) Experimental scheme. Mice were subjected to three 4-min sessions in the LC (top) in the following order (bottom, from left to right): control session in which chambers A and B were empty (E), the first social interaction session in which chamber A and chamber B contained a novel object (O) and a stranger mouse (M), respectively, and the second social interaction session in which chamber A and chamber B contained a stranger mouse and a novel object, respectively. (B) Total duration of time spent investigating chamber A and chamber B during control (“Cont”), first interaction (“1st”), and second interaction (“2nd”) sessions. nsa, P = 0.12, t(5) = 1.89; **b, P = 0.0022, t(5) = 5.75; *c, P = 0.036, t(5) = 2.86, paired t test, n = 6 mice (S1 Data, sheet Fig 3B). (C) A raster plot showing Ca2+ events of a population of AI neurons (n = 99 cells) imaged in a single experiment during the first interaction session. BMouse-ON cells are sorted above the red dashed lines. The epochs of nose poking to chamber A with a novel object (AObject) and chamber B with a stranger mouse (BMouse) are shown in the bottom panel and indicated by blue and green shades, respectively. (D–F) Pie charts showing the fractions of each category of cells during the control session (D), the first interaction session (E), and the second interaction session (F). n = 580 cells from 6 mice. (G) Changes in the fractions of A-ON, A-OFF, B-ON, and B-OFF cells across sessions (S1 Data, sheet Fig 3G). The content of each chamber is shown at the bottom. AI, agranular insular cortex; LC, linear chamber; ns, not significant.

