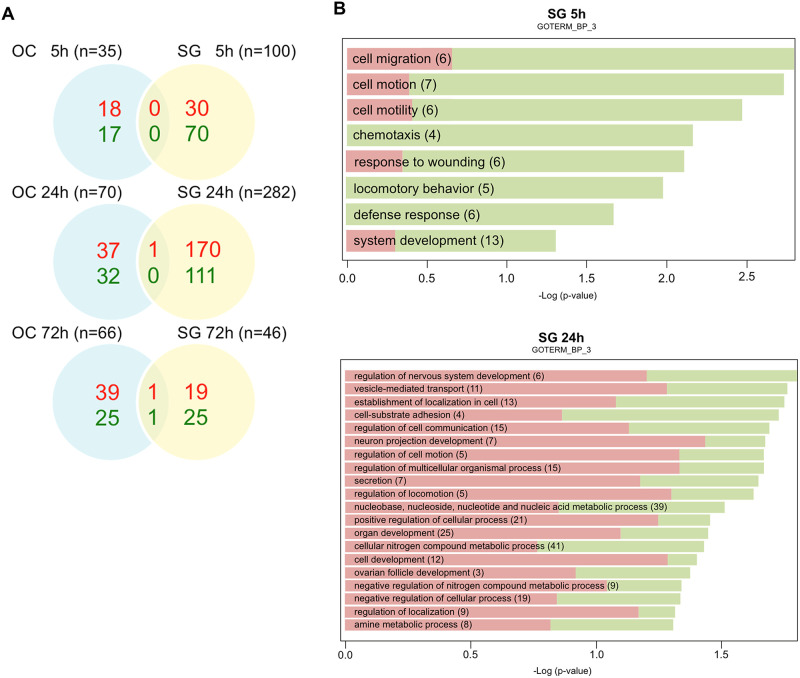
Fig 3. Gene expression changes in cochlear explants after kainate treatment.
(A) Differentially expressed genes after kainate treatment. mRNA from spiral ganglion neurons versus organ of Corti fractions was analyzed with microarrays at 5, 24, and 72 h after kainate treatment. Venn diagrams represent the numbers of transcripts that were either upregulated (red) or downregulated (green) at a significance of p<0.005 following kainate treatment relative to untreated controls at 5, 24, and 72 hours after treatment. (B) Gene Ontology (GO) analysis representing the major biological processes involved in the SG tissues at 5 and 24 h after kainate treatment. Over-represented GO categories among differentially expressed (DE) genes (in green the proportion of downregulated DE genes; in red the proportion of upregulated DE genes) sorted by -log10 (p value). The value 1.3 on the horizontal axis corresponds to p = 0.05. OC, organ of Corti; SG, spiral ganglion.

