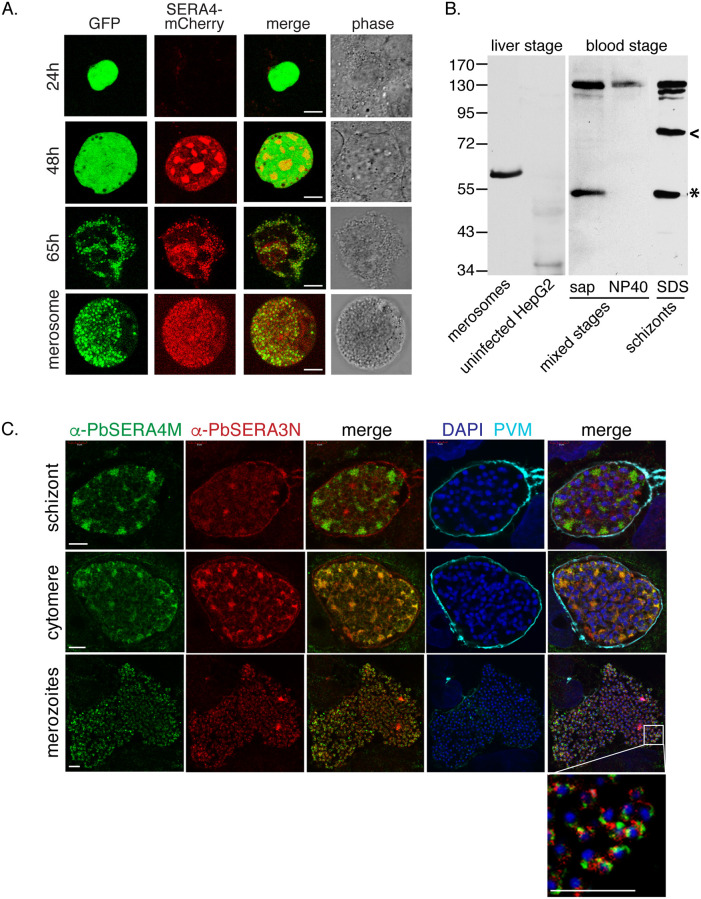
Fig 2. Proteolytic processing and localization of PbSERA4 in late liver-stage P. berghei.
(A) PbSERA4-mCherry is detected in late liver-stage P. berghei. Huh7 hepatoma cells were infected with the PbSERA4-mCherry P. berghei ANKA line, fixed at the indicated time points and imaged by confocal microscopy. The parasites were detected with constitutive, cytoplasmic GFP expression (green). Scale bars, 8 μm. (B) The α-PbSERA4M antibody detects full length PbSERA4 and PbSERA4 cleavage products. Liver-stage lysates were prepared from merosomes and detached cells (lane 1) collected from infected HepG2 cells and compared to uninfected HepG2 cells (lane 2). Proteins from mixed purified blood-stage parasites were initially solubilized with saponin and subsequently NP40 and compared to whole-cell SDS lysates of purified mature blood-stage schizonts. The predicted catalytic domain released by proteolytic processing is marked by the asterisk and appears to run slower in liver-stage compared to blood-stage samples. All displayed lanes are from one gel. (C) P. berghei ANKA-infected HepG2 cells were fixed at different time points (45-58h) post infection and stained with α-PbSERA4M (green) in comparison to α-PbSERA3N (red), α-PbEXP1 (cyan), which labels the parasitophorous vacuole membrane (PVM), and the DNA dye DAPI (blue). For easier interpretation, images obtained with α-PbSERA3N and α-PbSERA4M were merged individually. Additional merges with images obtained with DAPI and α-PbEXP1 are shown for orientation. Scale bar: 5μm.

