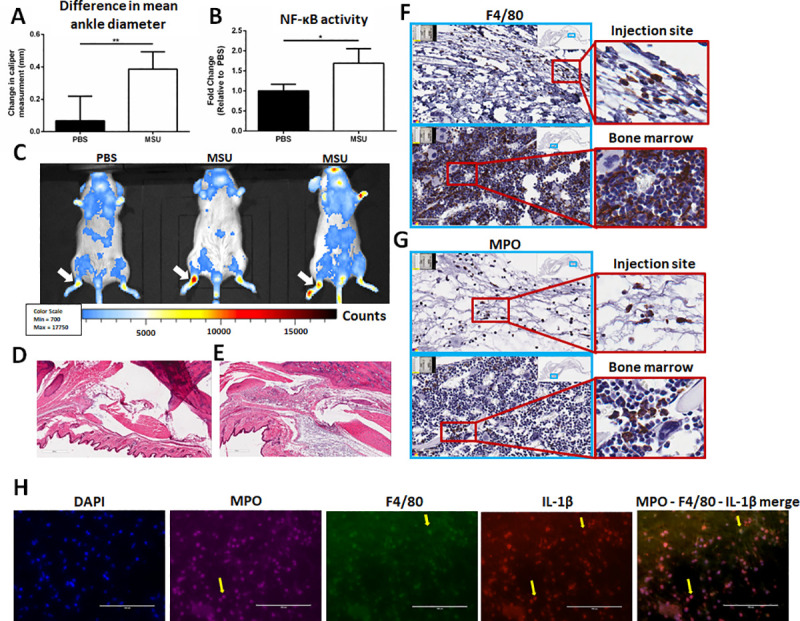
Fig 1. Establishment of an acute gout model in male mice with a bioluminescent reporter associated with NF-κB activity.

(A) Change in mean ankle diameter 15 hrs post-PBS/MSU injection. Values reported as changes in caliper measurement (final–initial) average ± SD. (n = 3; n = 7, respectively) (B) NF-κB activity was compared in injected feet by in vivo imaging (IVIS) between PBS and MSU treatments. Values reported as fold change (FC ± SD) relative to PBS (n = 3 PBS; n = 5 MSU). Analysis by two-tailed, nonparametric, unpaired Mann-Whitney t-test. *p<0.05, **p<0.01. (C) Whole-mouse comparison of bioluminescent signals between PBS (n = 3) and MSU (n = 5) crystal injected mice (white arrows indicate the site of injection). (D-E) Hematoxylin&Eosin (H&E) stains at 100x magnification in Aperioimage software of (D) PBS-injected and (E) MSU-injected ankle joint spaces. (F) F4/80 immunohistochemistry (IHC) of joint space (top) and bone marrow (bottom). (G) MPO IHC of joint space (top) and bone marrow (bottom). Images on left are 100x magnification and images on right are 400x magnification. Scanned using in Aperio image software. Bone marrow images represent positive controls for IHC staining. (H) Immunofluorescent staining of DAPI, MPO, F4/80, and IL-1β within the synovium of MSU-injected mice. Yellow arrows highlight co-localization of IL-1β expression for macrophages and neutrophils.
