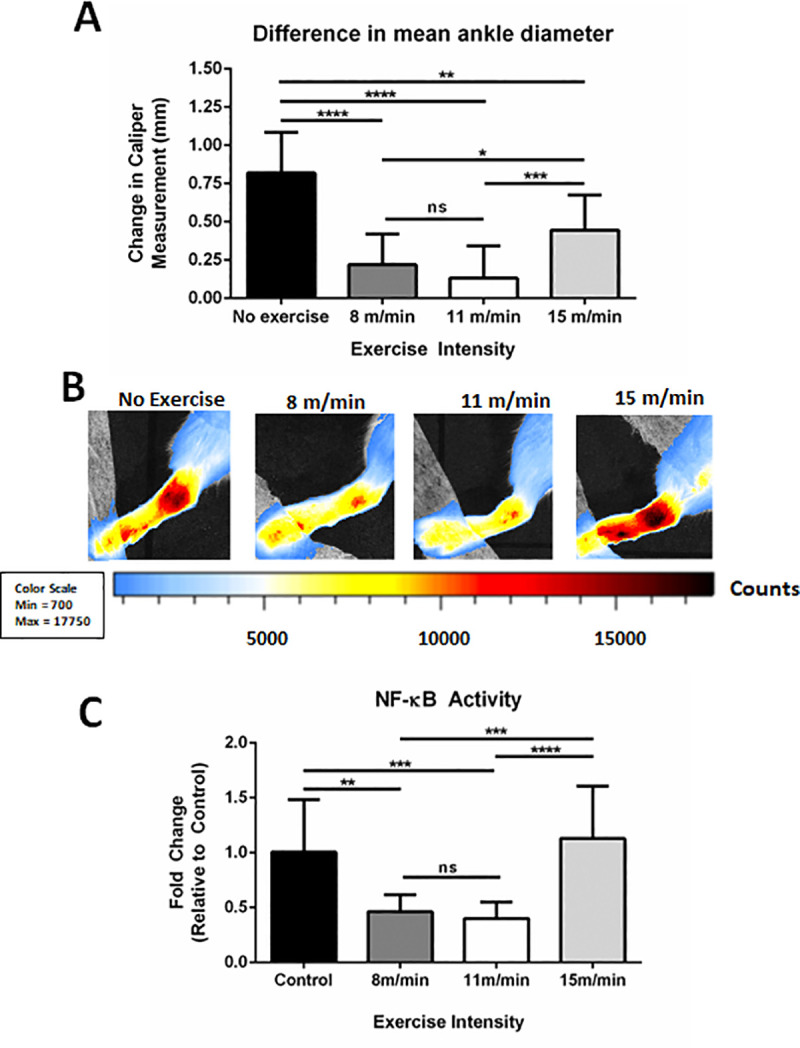
Fig 2. Mean difference in ankle diameter and NF-κB activity in MSU-injected mice following exercise regimens of varying intensity.

(A) Change in mean ankle diameter (swelling) between non-exercised, 8 m/min, 11 m/min, and 15 m/min groups. Values reported as changes in caliper measurement (final–initial) average ± SD (n = 10, 10, 22, 11, respectively). (B) Representative in vivo imaging system (IVIS) images of MSU injected ankles from non-exercised (n = 10), 8 m/min (n = 10), 11 m/min (n = 22), and 15 m/min (n = 10) groups. Scale of luminescent counts below. (C) Normalized IVIS intensity values as fold changes relative to non-exercised controls (FC ± SD). (n = 10, 10, 22, 11 respectively). Analysis by ANOVA and followed by two-tailed, nonparametric, unpaired Mann-Whitney t-tests. *p<0.05, **p<0.01, ***p<0.001, ****p<0.0001, ns = not significant.
