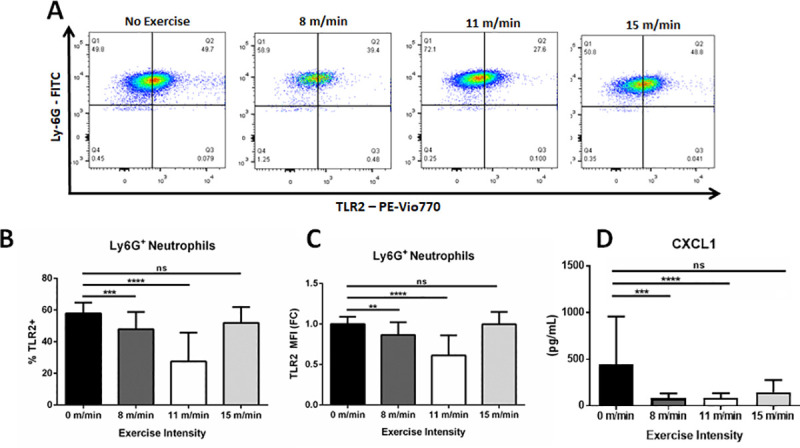
Fig 5. Analysis of and CXCL1 serum levels and TLR2 expression on peripheral neutrophils.

(A) Flow cytometry of TLR2 expression on Ly6G+ / CD115- neutrophils from the periphery of non-exercised control, 8 m/min, 11 m/min, and 15 m/min groups. Images are representative of multiple samples. (B) Analysis of percent TLR2+ neutrophils and (C) TLR2 MFI from non-exercised, 8 m/min, and 11 m/min conditions. (n = 10, 15, 15, and 10 samples run in duplicate, respectively). (D) ELISA analysis measuring CXCL1 expression in serum. Statistical analysis by ANOVA and followed by two-tailed, nonparametric, unpaired Mann-Whitney t-tests. Error bars ±SD. *p<0.05, **p<0.01, ***p<0.001, ****p<0.0001, ns = not significant.
