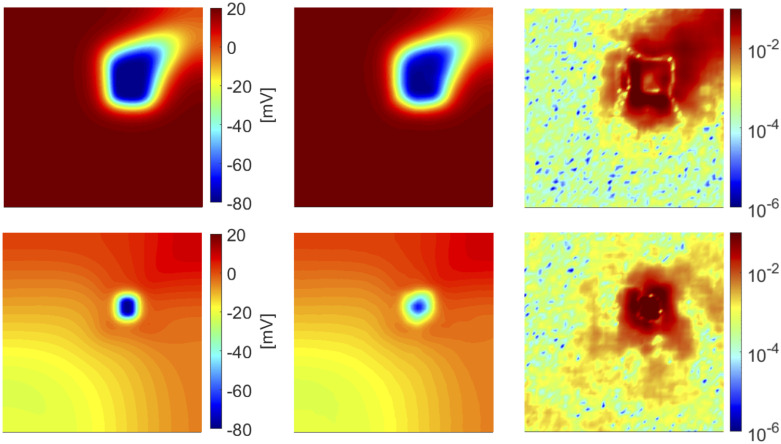
Fig 2. Test 1: Comparison between FOM and DL-ROM solutions for a testing-parameter instance.
FOM solution (left), DL-ROM solution with n = 3 (center) and relative error ϵk (right) for the testing-parameter instance μtest = (6.25, 6.25) cm at ms (top) and ms (bottom). The maximum of the relative error ϵk is 10−3 and it is associated to the diseased tissue.

