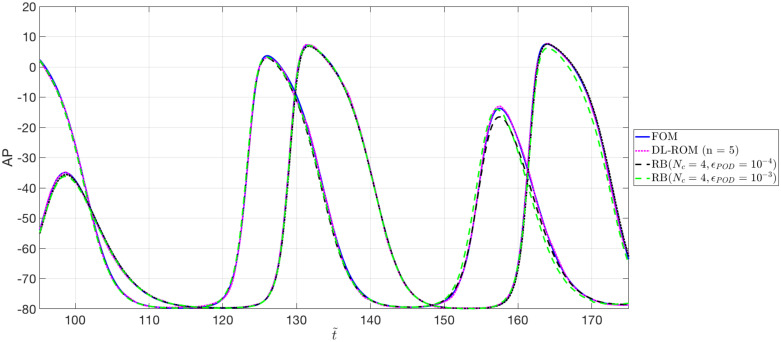
Fig 11. Test 2: FOM, DL-ROM and POD-Galerkin ROM APs at P1 and P2.
AP obtained through the FOM, the DL-ROM and the POD-Galerkin ROM with Nc = 4, for the testing-parameter instance μtest = 0.9625 cm, at P1 = (0.64, 1.11) cm and P2 = (0.69, 1.03) cm. The POD-Galerkin ROM approximations are obtained by imposing a POD tolerance εPOD = 10−4 and 10−3, resulting in error indicator (15) values equal to 5.5 × 10⁻³ and 7.6 × 10⁻³, respectively.

