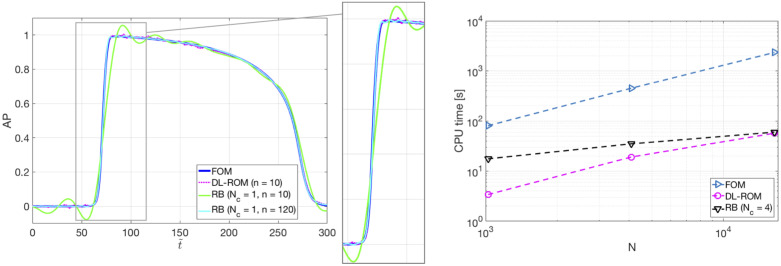
Fig 16. Test 3: FOM, DL-ROM and POD-Galerkin ROM APs for a testing-parameter instance.
FOM and DL-ROM CPU computational times. Left: FOM, DL-ROM and POD-Galerkin ROM APs for the testing-parameter instance μtest = 12.9 ⋅ 0.31 mm2/ms. For the same n, the DL-ROM is able to provide more accurate results than the POD-Galerkin ROM. Right: CPU time required to solve the FOM, by DL-ROM with n = 10 and by the POD-Galerkin ROM with Nc = 6 at testing time vs N. The DL-ROM is able to provide a speed-up equal to 41.

