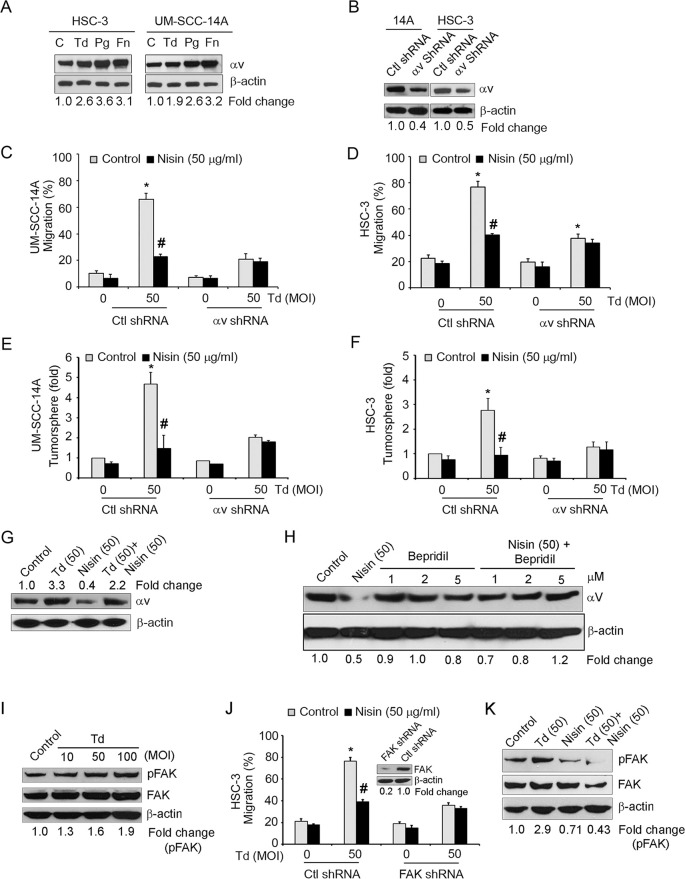
Fig 6. Pathogen-enhanced OSCC cell migration is mediated in part via integrin alpha V and FAK Signaling.
(A) Representative immunoblots of three independent experiments showing integrin alpha V protein levels in UM-SCC-14A and HSC-3 cells challenged with control medium or media containing different MOIs of T. denticola, P. gingivalis or F. nucleatum for 2 h then cultured for 24 h. β-actin was used as a loading control for all immunoblots. (B) Representative immunoblots of three independent experiments showing integrin alpha V protein levels in cells transduced with control shRNA or alpha V shRNA. Lower panel represents the fold change values of alpha V expression using image J analysis. (C and D) Graphs show the total migratory distance of cells from the edges of the wounds. Measurements were made after 24 h. (E and F) Graphs show the fold changes in orasphere formation after 24 h. Data represent mean ± SD from three independent experiments. (G) Representative immunoblots of three independent experiments showing integrin alpha V protein levels in UM-SCC-14A cells challenged with control medium or media containing T. denticola (50 MOI) for 2 h then treated with nisin (50 μg/ml) for 24 h. (H) Representative immunoblots of three independent experiments showing alpha V protein levels in HSC-3 cells treated with nisin (50 μg/ml), Bepridil (1, 2, 5 μM), or nisin plus Bepridil (1, 2, 5 μM) for 24 h. (I) Representative immunoblots of three independent experiments showing phospho-FAK and FAK protein levels in HSC-3 cells challenged with control medium or media containing different MOIs of T. denticola for 2 h then cultured for 24 h. (J) Graphs show the total migratory distance of cells from the edges of the wounds. Measurements were made after 24 h. Data represent mean ± SD from three independent experiments. (Inset), Representative immunoblots of three independent experiments showing FAK protein levels in cells transduced with control shRNA or FAK shRNA. *Comparison between groups relative to their media controls *p≤0.05; #Comparison between groups relative to their matching concentrations of pathogens alone #p≤0.05. (K) Representative immunoblots of three independent experiments showing phospho-FAK and FAK protein levels in HSC-3 cells challenged with control medium or media containing T. denticola (50 MOI) for 2 h then treated with nisin (50 μg/ml) for 24 h.

