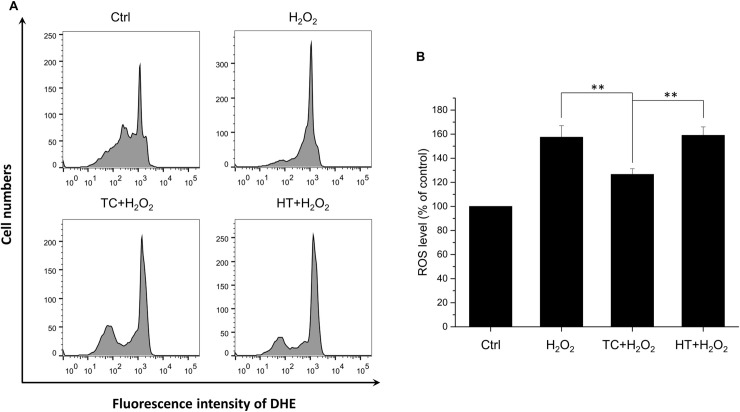
Fig 4. Effect of TC-HT on H2O2-induced ROS generation in SH-SY5Y cells.
(A) ROS level was measured 24 h after the H2O2 treatment by flow cytometry with DHE fluorescent dye. (B) Quantification of the ROS levels after H2O2, TC+H2O2, or HT+H2O2 treatment. Data represent the mean ± standard deviation (n = 3). **P < 0.01.

