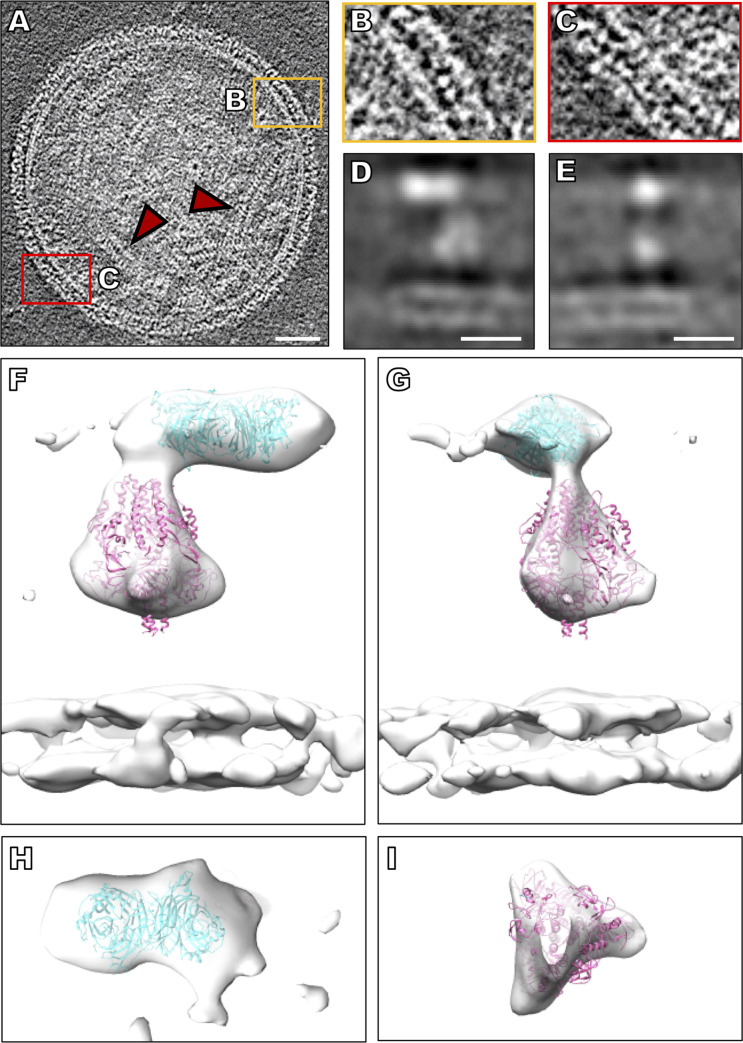
Fig 2. Viral tomographic reconstructions.
(A) Contrast inverted cryo-ET central slice of HPIV3 before receptor engagement. Red arrows indicate ribonucleoprotein helical tubes. (B, C) Enlarged regions of the surface glycoproteins with HN and F in tight arrangement. (D, E) Central (D) X slice and (E) Y slice through the subtomogram average of HPIV3 surface glycoproteins. (F, G) Sub-volume average of surface glycoproteins with crystal structure of the HN dimer (PDB ID: 4MZA) and the cryo-EM structure of pre-fusion F (PDB ID: 6MJZ) in green and pink (respectively), fitted into the sub-volume average. (H) Top-down view of HN and (I) top-down view of F. Scale bars: (A) 50 nm and (D, E) 10 nm.

