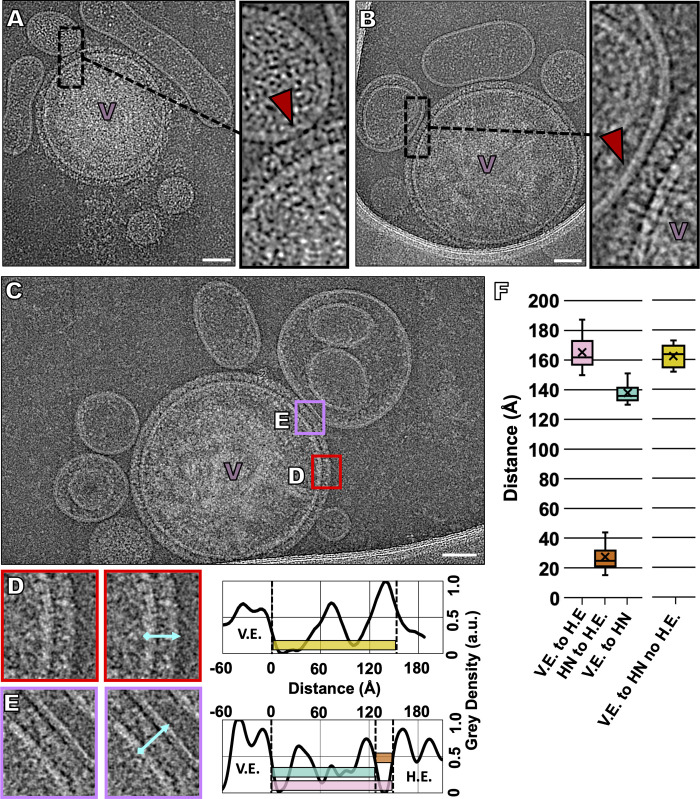
Fig 3. Imaging the interaction of the HPIV3 virions with a natural host receptor.
To capture viral-host interactions and prevent the activation of F, samples were incubated at 4°C prior to vitrification. (A, B, C) Contrast-inverted (A) cryo-ET and (B, C) cryo-EM images of HPIV3 interactions with target erythrocyte fragment membranes. Insets: enlarged areas show thin lines of density connecting HN to the target erythrocyte fragment membranes. (D, E) Enlarged regions (D) distal and (E) proximal to the viral-host interaction site with accompanying density line plots of each region. Relative density measurements in arbitrary units (a.u.) of the space between the viral envelope (V.E.) and HN or the target human erythrocyte fragment membrane (H.E.) with distances measured from positions of half-maximum density (distance at half-maximum density of outer leaflet to peak intensity distal to membrane), showing the positions of each viral envelope glycoprotein. (F) Box plot of distances measured from regions equivalent to (D) and (E) with each distance represented by boxes of the same color as those overlaid in the graphs of panels (D) and (E). Dashed vertical lines indicate half maximum distance of the viral envelope (V.E.), HN, and host envelope (H.E.). Numbers indicate average heights of 38 measurements with +/- standard deviations. Scale bars: (A, B, C) 50 nm.

