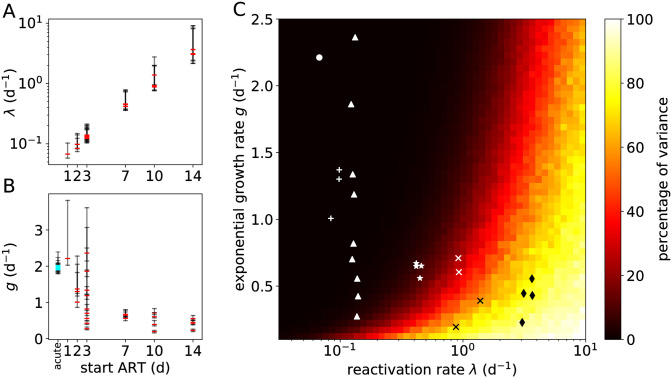
Fig 4. Estimates of recrudescence and growth rates from the SIV rebound data and the percentage of the variance of the time-to-rebound.
(A) Point estimates (posterior modes; red) and 50% CrIs (black) of λ for each macaque as a function of the time ART was initiated. (B) Estimates of g. The cyan markers denote estimates of the growth rate for acute infections of 13 of the 25 macaques. These acute VL growth rates cluster around 2 d−1. (C) Proportion of the total variance due to secondary reactivation events. The heat map shows Var[τ1]/Var[τ0] ⋅ 100%, where τi ≔ inf{t : Vt ≥ ℓ, V0 = i ⋅ v0} is the rebound time (i = 0) or the time between the first successful reactivation and rebound (i = 1). Additional parameters are v0 = 0.1 copies mL−1 and ℓ = 50 copies mL−1. The markers indicate the estimates from macaque SIV rebound experiments in which the macaques were treated, starting tART days after infection, with tART equal to 1 day (●), 2 days (+), 3 days (▲), 7 days (★), 10 days (×), or 14 days (♦).

